
Figure 6. Somatodendritic TrkA kinase inhibition results in decreased synaptic puncta in the SCG.
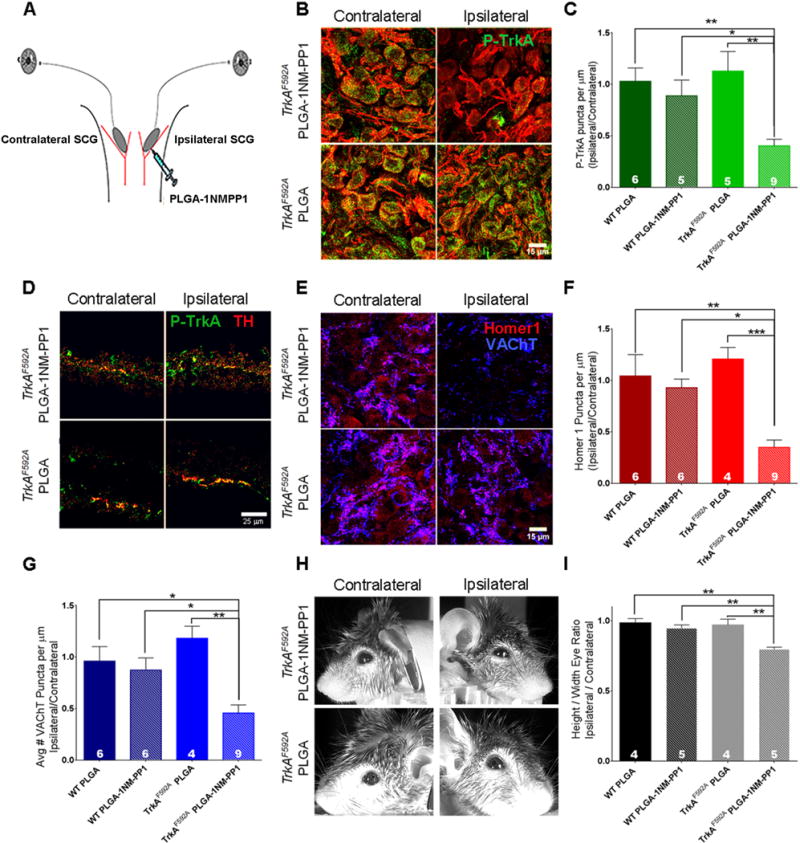
A. Schematic of the assay used to inhibit TrkA signaling in the somatodendritic compartment of postganglionic neurons in vivo: injection of 1NMPP1 loaded PLGA micropsheres into one (ipsilateral) SCG of TrkAF592A mice. All analyses were performed 6–8 hours after injection. B. Reduction of P-TrkA puncta in the injected ganglion (right), but not the contralateral ganglion (left) of TrkAF592A mice. No changes of P-TrkA level was observed in TrkAF592A mice injected with control PLGA microspheres. C. Quantification of number of ipsilateral P-TrkA puncta compared to number of contralateral P-TrkA puncta in PLGA microsphere or PLGA-1NMPP1 microsphere injected TrkAF592A and wild-type (WT) mice. One way ANOVA F (3, 21) = 8.091 P<0.001 post hoc Tukey’s multiple comparisons’ test: *p<0.05. D. Similar level of P-TrkA (Y785) staining in TH+ sympathetic axons innervating the iris was observed in both contralateral (left) and ipsilateral (right) target fields in TrkAF592A mice injected with either PLGA microspheres or PLGA-1NMPP1 microspheres. E. Reduction of VAChT and Homer1 puncta in the ipsilateral ganglion (right), but not the contralateral ganglion (left) of TrkAF592A mice. F and G. Quantification of number of ipsilateral SCG Homer1 (F) and VAChT (G) puncta compared to the number of contralateral SCG Homer1 (F) and VAChT (G) puncta in either PLGA microsphere or PLGA-1NMPP1 microsphere injected TrkAF592A and WT mice. Homer1: One way ANOVA F (3, 21) = 10.06 P<0.0005 post hoc Tukey’s multiple comparisons’ test: *p<0.05. VAChT: One way ANOVA F (3, 21) = 10.06 P<0.005 post hoc Tukey’s multiple comparisons’ test: *p<0.05. H. Representative images of ptosis in ipsilateral eyes compared to contralateral of PLGA microsphere or PLGA-1NMPP1 microsphere injected TrkAF592A mice. I. Quantification of ptosis (ratio of height over width of the eye) comparing the ipsilateral eye to the contralateral eye. One way ANOVA F (3, 14) = 10.64 P<0.001 post hoc Tukey’s multiple comparisons’ test: *p<0.05. Data are presented as mean ± SEM. See also Figure S5.