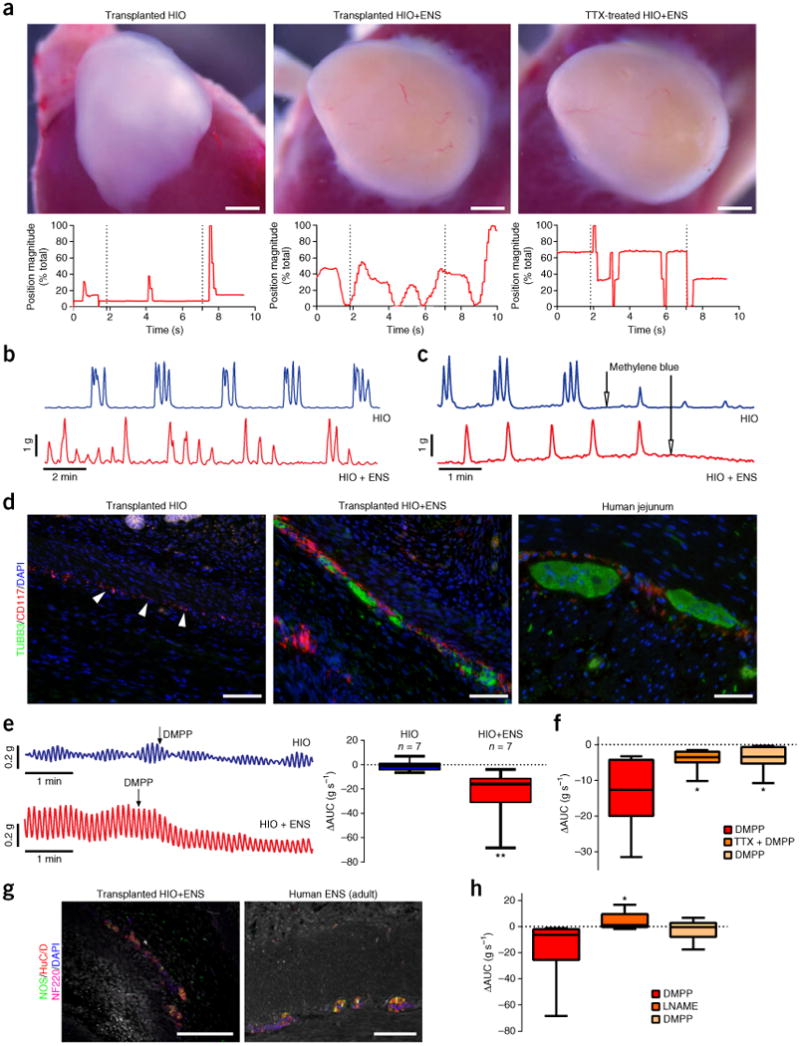
Figure 4.

ENS-independent and dependent control of contractile activity. (a) The ENS in HIOs mediates peristaltic-like contractions (see Supplementary Videos 7–9). In vivo grown tissues were explanted and subjected to EFS. HIOs without ENS subjected to high-voltage EFS (1-ms pulse at 100 V) showed one contraction (left, n = 2). HIOs+ENS subjected to low-voltage EFS (1-ms pulse at 50 V) showed a sustained series of wave-like contractions (middle, n = 5) that were lost when tissues were cultured in TTX (TTX-treated HIOs+ENS, right; n = 2). Automated point tracking demonstrated a differential movement in HIOs+ENS, as compared to HIOs, that was lost after TTX treatment. Scale bars, 1 mm. (b) Recordings of spontaneous contractions in transplanted HIO and HIO+ENS tissue strips. Phasic contractions were observed after tissue equilibration (no stimulation), suggestive of ICCs in both HIO (n = 7) and HIO+ENS (n = 7) tissues. (c) Inhibition of ICC activity with methylene blue led to loss of contractile activity (n = 3). (d) Detection of ICCs (CD117, red) in both HIOs and HIOs+ENS in vivo. HIOs without NCCs did not form neurons (TUBB3, green). Scale bars, 100 μm. (e) DMPP stimulation in HIOs and HIOs+ENS. Right, area under the curve (AUC) during DMPP (10 μM) stimulation measured for 2 min before and after stimulation (n = 7). (f) TTX inhibition of ENS activation. DMPP stimulation measured for 2 min, followed by TTX (10 μM) treatment of HIOs+ENS (n = 7). (g) NOS+ neurons were present in HIOs+ENS grown in vivo. Scale bars, 100 μm. (h) ENS-induced relaxation by a NO-dependent mechanism. Shown is the AUC during DMPP stimulation measured for 2 min, followed by L-NAME treatment of HIOs+ENS (n = 7). For box and whisker plots, the black line across the box represents the median, the box represents interquartile range and the whiskers represent the minimum and maximum. *P < 0.05, **P < 0.01, Mann–Whitney test.
