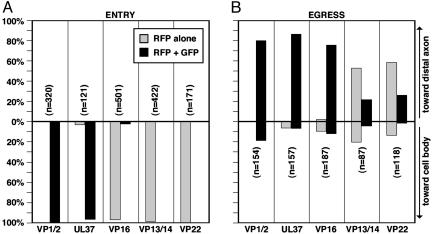
Fig. 3.
Summary of herpesvirus axonal transport. Quantitation of capsid transport in axons is plotted with the proportion of capsids moving anterograde (to the axon terminal) above and retrograde (to the cell body) below. The proportion of transported capsids alone and capsids complexed with tegument is presented as the percentage of the total number of transported capsids (n) observed for each virus. (A) Capsid transport to the soma during the first hpi. (B) Capsid transport to axon terminals from 12 to 15 hpi.

