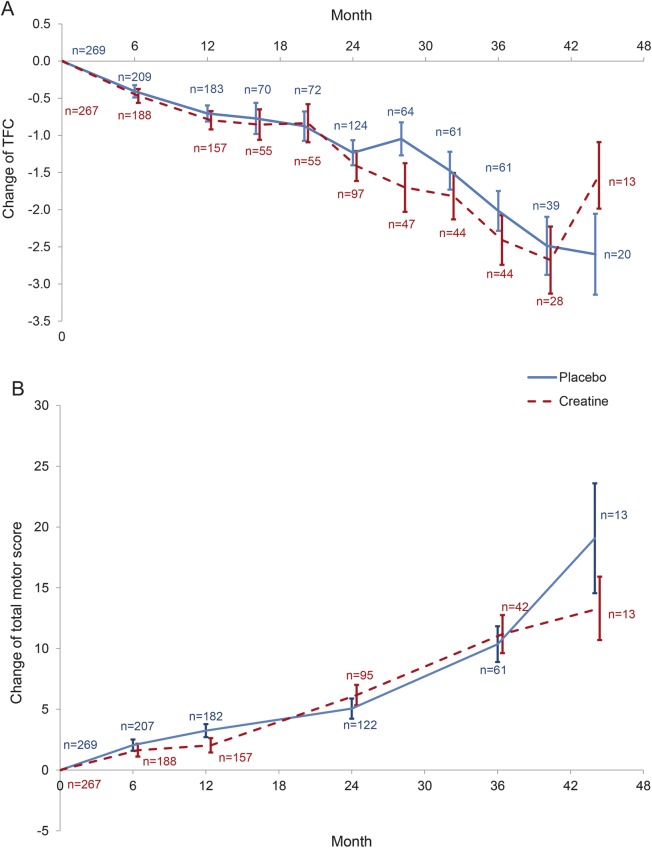
Figure 2. Changes from baseline to each visit in total functional capacity (TFC) and total motor score (TMS), mean ± standard error.
(A) TFC for all patients assigned to active creatine and to placebo. (B) TMS for all patients assigned to active creatine and to placebo. In A (primary analysis) and B (supporting analysis), the 2 track curves track closely except at the final point where the data are sparse (see text for details).

