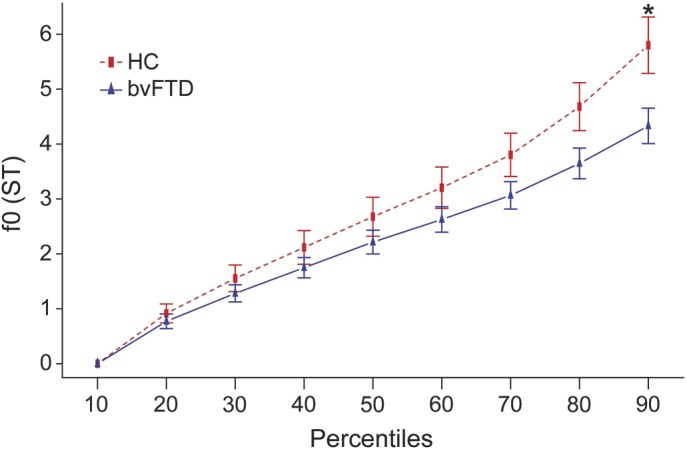
Figure 1. Fundamental frequency percentiles per group.

Fundamental frequency (f0) estimates in 10th percentile bins for healthy controls (HC) (n = 17) and behavioral variant of frontotemporal dementia (bvFTD) patient group (n = 32) with standard error bars. The f0 range is represented by the 90th percentile and is limited to 4.3 ± 1.8 semitones (ST) for the patient group compared to HC (5.8 ± 2.1 ST). *p = 0.03.
