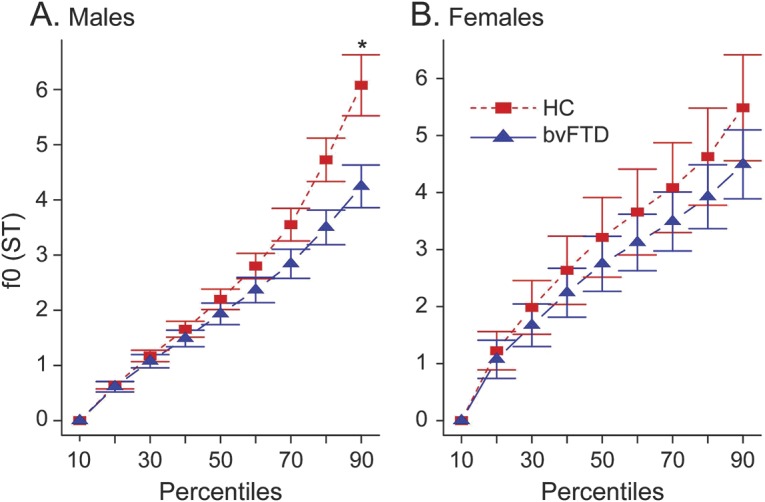
Figure 2. Fundamental frequency percentiles by group and sex.

Fundamental frequency (f0) estimates in 10th percentile bins within sex subpopulations. (A) Decreased f0 range as represented by the 90th percentile f0 estimate in male patients with behavioral variant of frontotemporal dementia (bvFTD) compared to male healthy controls (HC) (*p = 0.01). (B) f0 range in female patients is only slightly limited compared to female HC with no statistical difference (p = 0.55). ST = semitones.
