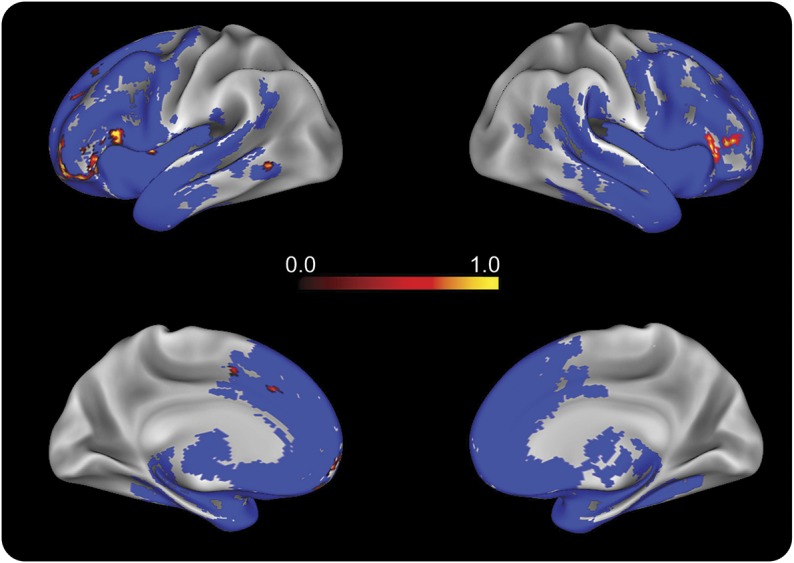
Figure 4. Gray matter (GM) density analysis.

GM atrophy in the behavioral variant of frontotemporal dementia (bvFTD) patient group (n = 32) compared to the healthy control group (n = 17) is indicated in blue. Regression associating reduced f0 range with GM atrophy in patients with bvFTD is indicated with heat map representing voxel p value (analysis threshold was set at 0.05—refer to table e-1 for detailed peak voxels).
