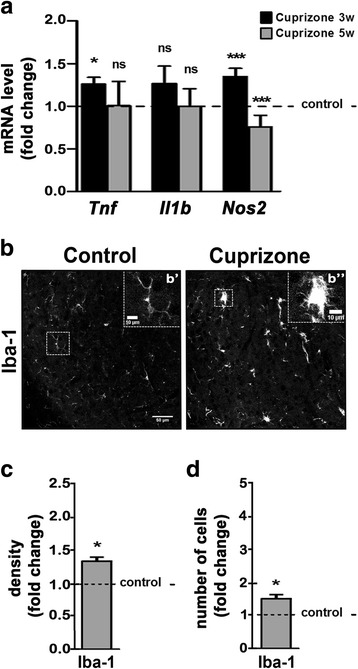
Fig. 2.

Cuprizone treatment leads to inflammatory responses within the dorsal lateral geniculate nucleus (dLGN). a Bar graph depicting mRNA levels for TNF-α (Tnf), IL-1-β (Il1b), and iNOS (Nos2). n = 3: Tnf, Il1b, Nos2 control and cuprizone 5w; n = 4: Nos2 control and cuprizone 3w; n = 6: Tnf control and cuprizone 3w; n = 8: Il1b control and cuprizone 3w. b Representative confocal images of the dLGN within mouse brain sections immunostained for the microglia/macrophage-specific calcium-binding protein Iba-1 at 5 weeks of cuprizone treatment (right panel) or under control conditions (left panel). The insets in b’ and b” show the areas marked by the dashed white squares. Note the higher number of surveillant microglia (discrete cell bodies with thin processes, b’ under control conditions compared to the higher number of activated microglia (enlarged cell bodies with thick processes, b” upon cuprizone treatment. Scale bars: 50 and 10 μm (insets). c, d Bar graphs depicting the density of mmunostained areas (c) and the number of immuno-positive cells (d) at 5 weeks of cuprizone treatment compared to control conditions (dotted line). Two fields per slice and two slices per animal (n = 3: control and cuprizone) were analyzed. All bar graphs depict means ± SEMs. *p < 0.05, **p < 0.01, ***p < 0.001, not significant (ns) p ≥ 0.05 (one-sample t test; compared to set control value = 1)
