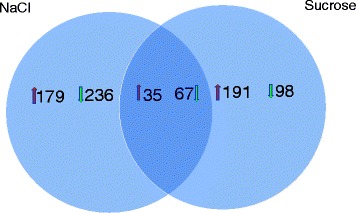
Fig. 5.

Global gene expression responses following salt and osmotic stress. Venn diagram showing the extent of overlap between genes differentially expressed under salt and osmotic stress in the salt-tolerant strain Frankia sp. CcI6. The arrows indicate the number of up-regulated and down-regulated genes under salt and osmotic stress. The intersection indicates the number of differentially expressed genes under both conditions
