Fig. 6.

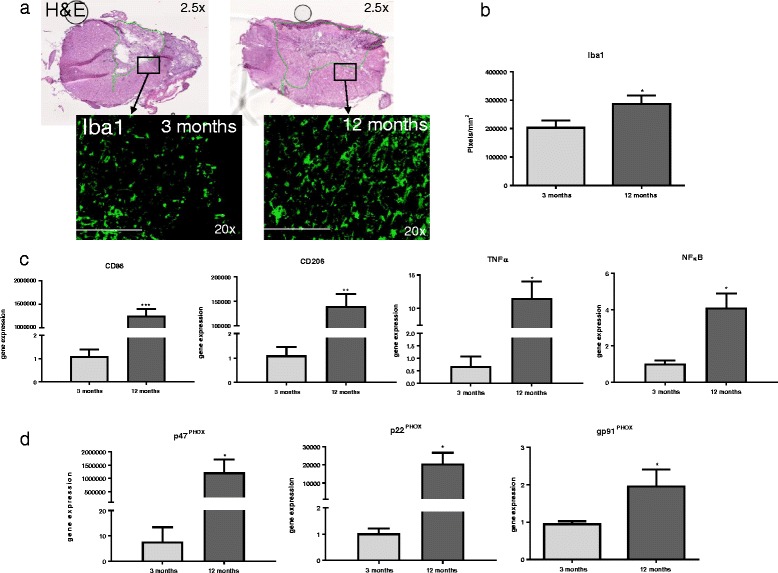
Microglial and NOX2 component activation and gene expression after spinal cord injury at 30 dpi. a 30 dpi H&E-stained images of 3 and 12-month-old injured spinal cord. Black boxes depict location of Iba1-stained quantification, in the closest intact tissue outside the central cavity of the injury. Black arrows point to corresponding images of immunofluorescent staining of Iba1. b Twelve-month-aged rats showed significantly greater staining in comparison to 3-month-aged rats at 30 dpi. N = 4/group. c Comparative RT-PCR reveals significant increase in gene expression of the M1 phenotype marker cd86, M2 phenotype marker cd206, and inflammatory cytokines TNFα and NFκB in 12-month-aged rats compared to that in 3-month-aged rats, suggesting an overall increase in microglial gene expression after injury with age. d Comparative RT-PCR of NOX2 components p47PHOX, p22PHOX, and gp91PHOX reveal a significant increase in gene expression of all three genes in 12-month-aged rats compared to 3-month-aged rats at 30 dpi. N = 4/group. *p < 0.05, **p < 0.005, ***p < 0.0005. Bars represent mean ± SEM
