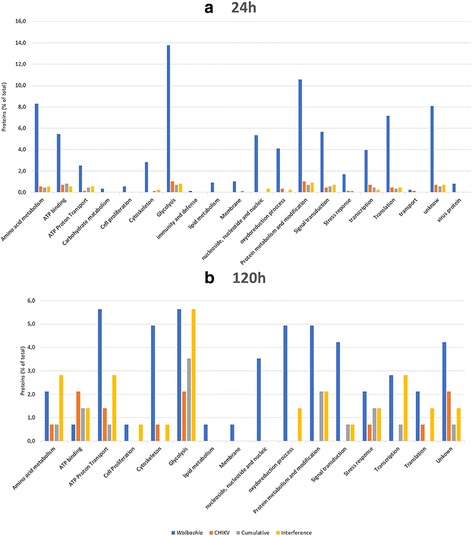
Fig. 4.

Functional categorization of proteins found in differentially regulated spots of C6/36 cells under different infection modalities. a At 24 h post infection, (b) at 120 h post infection by CHIKV. Blue bars, functions impacted by Wolbachia (Monoinfection and dominance profile); red bars, functions impacted by CHIKV (Monoinfection and dominance profile); gray bars, functions impacted by cumulative effect; yellow bars, functions impacted by interference effect. The results are expressed in % values of total differentially accumulated proteins by cell functions (p < 0.02; 2-fold change)
