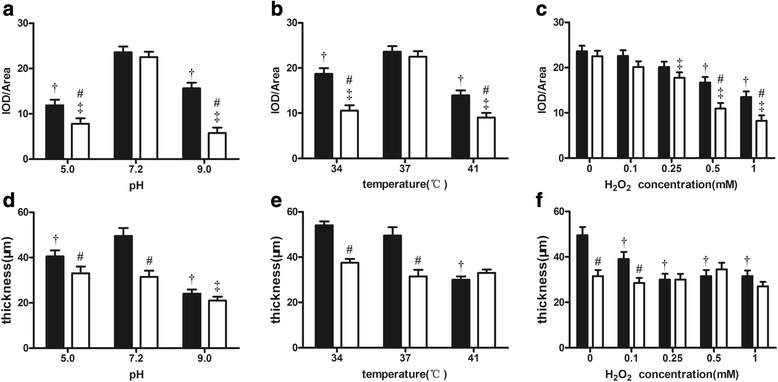
Fig. 5.

Comparison of the mean thickness (a, b and c) and fluorescence density (d, e and f) of biofilms between the P. gingivalis W83 (■) and ΔPG0352 (□) strains cultured under stressful conditions. † for P. gingivalis W83, the difference is significant between normal and stressful conditions, P < 0.05;. ‡ for the ΔPG0352 mutant, the difference is significant between normal and stressful conditions, P < 0.05; # versus P. gingivalis W83 under the same culture conditions, P < 0.05
