
Fig. 8.
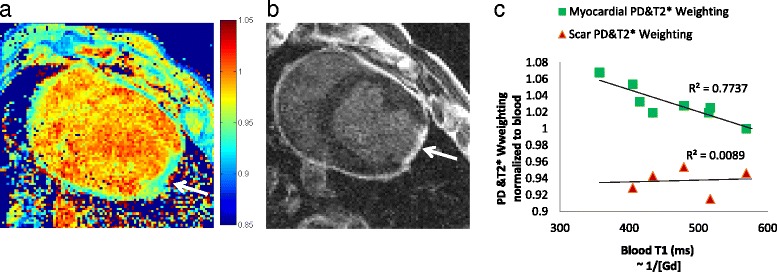
a A representative image of the proton density and T2* weightings in one pig, shown with the matching slice from the LGE volume (b). The map in (a) was normalized to the average weighting for blood. Note that the region with scar demonstrates a slightly lower weighting (~0.93). c A plot of the PD and T2* weighting ratios for each subject for myocardium to blood and scar to blood ratios, plotted vs. blood T1. The PD and T2* weighting had a mean scar/blood ratio of 0.94 ± 0.01 and a mean myocardium/blood ratio of1.03 ± 0.02