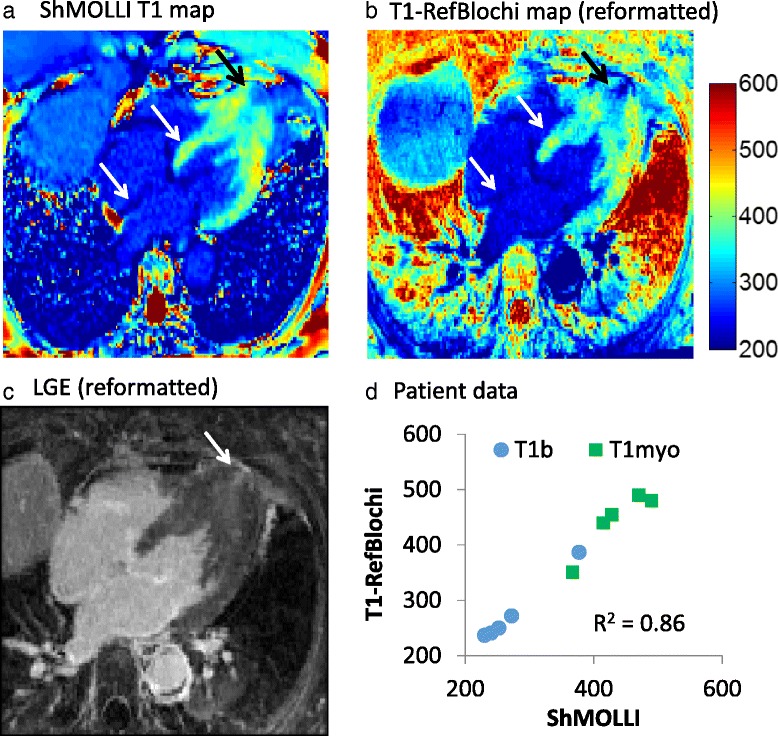
Fig. 9.

Post-contrast T1-maps with ShMOLLI, and refBlochi, acquired consecutively, in a hypertrophic cardiomyopathy patient. a 4-Chamber ShMOLLI. b Reformatted 3D refBlochi. Colormap is identical. The blood T1 (240 ms) in ShMOLLI was the reference T1. Note the similar T1 s of the myocardium, valves, and scar (arrows). The reformatted refBlochi T1 map provides more detailed view of the apical infarct. c The reference 3D LGE reformatted in 4 chamber view shows the scar (white arrow). d Measured myocardial and blood T1 from all five patients, with Bland-Altman limits of agreement given as bias ±2SD of −9 ± 42 ms
