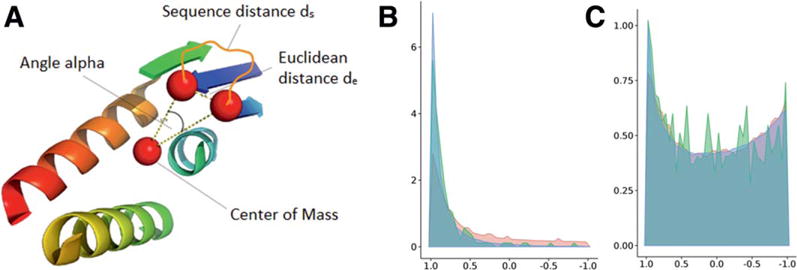
Figure 10.

Visualization of loop angle metric, which measures the angle α between the end of one SSE (dark blue), the center of gravity, and the beginning of the next SSE (light blue; A). The density distribution of the cos(α) metric for loop regions between consecutive SSEs only is concentrated to acute angles for PISCES and CASP10 natives (B, blue and red, respectively). BCL models exhibit a higher number of large angles for consecutive loops (B, red). The density distribution of the cos(α) metric for loop regions between all possible SSEs shows two frequently found angles, small ones and large ones, for all sets, BCL models (red), CASP10 natives (green) and PISCES (blue; C). [Color figure can be viewed in the online issue, which is available at wileyonlinelibrary.com.]
