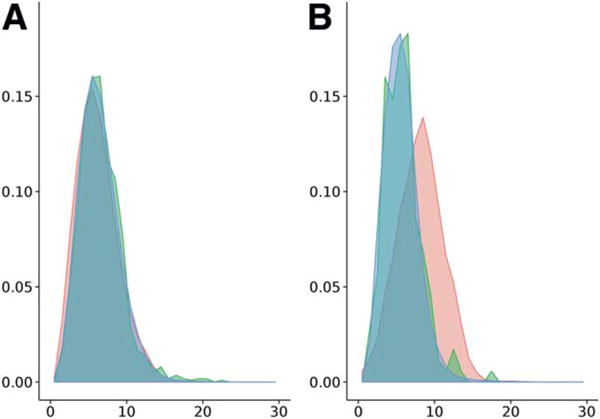
Figure 9.

The density distribution of the BCL loop score displaying Euclidean distance over the logarithm of the sequence separation for loop regions between all SSEs (A) and consecutive SSEs only (B). While the distributions of BCL models (red), CASP10 natives (green) and PISCES dataset (blue) match each other for loops between all SSEs (A), the distribution of BCL models shows a shift when only loops between consecutive SSEs are considered (B). [Color figure can be viewed in the online issue, which is available at wileyonlinelibrary.com.]
