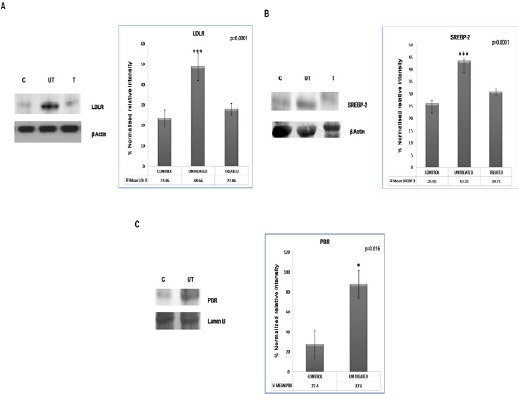
Figure 1.

Expression of LDLR, SREBP2 and Nuclear PBR: Respective antibodies were used to visualize the expression of LDLR, SREBP2 and PBR by western blotting. Three groups of subjects-control (C), untreated (UT) and treated (T)-were included in the study. A 2-tailed unpaired Student’s t-test was employed to determine statistical significance. Each bar represents the mean ± SD for 25 samples from each respective category. Significantly greater LDL receptor (panel A; p=0.0001), SREBP2 (panel B; p=0.0001) and PBR (panel C; p=0.016) expression was observed in the untreated leukemic group than in lymphocytes from the control subjects. The values here depict the densitometric measurements of the blots using an alpha image analyzer. β-actin and lamin B were used as internal markers. Treatment showed (data not shown for PBR) partial recovery
