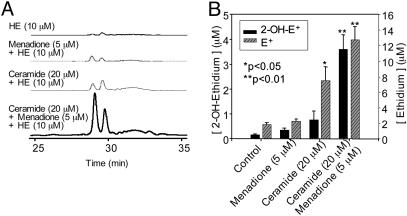
Fig. 7.
HPLC analysis of  production in BAECs treated with menadione and ceramide. (A) HPLC traces of cell lysates obtained from the control cells and from cells preincubated with ceramide (20 μM) for 6 h followed by menadione (5 μM) treatment. Cells were washed and treated with HE (10 μM) as described in the Fig. 3 legend. (B) The actual concentrations of 2-OH-E+ and E+ peaks calculated by using the calibration shown in Fig. 4.

