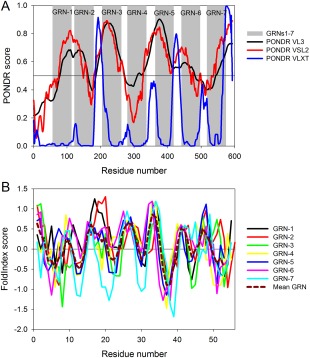
Figure 3.

Intrinsic disorder propensity of human PGRN and individual GRNs. (A) Evaluation of intrinsic disorder propensity in human PGRN (UniProt ID: P28799) by PONDR® VL3 (black curve), PONDR® VSL2 (red curve), and PONDR® VLXT algorithms (green curve). In this analysis, regions with scores above 0.5 are considered intrinsically disordered. Position of individual GRNs are shown by gray shaded areas. (B) Intrinsic disorder propensities of individual human GRNs by the FoldIndex algorithm. Data for the individual GRNs are presented by differently colored solid curves. In this analysis, positive values represent regions/residues likely to be folded, and negative values represent those likely to be intrinsically disordered. Dashed dark red curve describes the behavior of mean Grn. The corresponding data were obtained by simple averaging of disorder profiles of individual GRNs.
