Abstract
There has been an increased interest in computational methods for amyloid and (or) aggregate prediction, due to the prevalence of these aggregates in numerous diseases and their recently discovered functional importance. To evaluate these methods, several datasets have been compiled. Typically, aggregation‐prone regions of proteins, which form aggregates or amyloids in vivo, are more than 15 residues long and intrinsically disordered. However, the number of such experimentally established amyloid forming and non‐forming sequences are limited, not exceeding one hundred entries in existing databases. In this work, we parsed all available NMR‐resolved protein structures from the PDB and assembled a new, sevenfold larger, dataset of unfolded sequences, soluble at high concentrations. We proposed to use these sequences as a negative set for evaluating methods for predicting aggregation in vivo. We also present the results of benchmarking cutting edge tools for the prediction of aggregation versus solubility propensity.
Keywords: NMR, soluble, database, aggregation, 3D structure, amyloid fibrils, computational approaches
Introduction
The large majority of proteins are soluble under native conditions. However, numerous studies have demonstrated that, upon a change of conditions and (or) depending on the amino acid sequence, otherwise globular or unstructured proteins can assemble into insoluble, stable aggregates of unlimited dimensions, consisting of either amyloid fibrils or amorphous clumps.1, 2, 3, 4, 5, 6 Although, it has been shown that amyloids can also play “beneficial” biological roles,4, 7, 8 such irreversible aggregates are not generally tolerated in cells. For example, the aggregates in the form of amyloid fibrils are linked to a broad range of human diseases, which include, but are not limited to, type II diabetes, rheumatoid arthritis, and perhaps most importantly, debilitating neurodegenerative diseases such as Alzheimer's disease, Parkinson's disease, and Huntington's disease. In addition, the accumulation of recombinant proteins into aggregates is a major biotechnological problem.9, 10 Hence, it is extremely important to be able to evaluate correctly the potential of proteins to aggregate. Over the last decade, numerous studies have demonstrated that if the polypeptide chain is unfolded, its propensity to form aggregates is inherently determined by the amino acid sequence (reviewed in Ref. 1). Thus, a number of computational methods to predict amyloidogenicity and in a broader sense protein aggregation, based on the analysis of amino acid sequence, have been developed.1, 11, 12, 13, 14, 15, 16, 17, 18
To evaluate prediction methods, benchmark datasets of aggregate‐forming and non‐forming sequences are required. The primary problem here is the limited number of well‐established cases for these datasets. The first datasets used short peptides (∼6 residues). The reasons were that short peptides can be synthesized easily and tested in the same or similar experimental conditions for the presence or absence of amyloid fibrils. Moreover, short peptides are unfolded, and, therefore, they do not have the problem of structurally hidden regions found in folded proteins. The initial dataset was developed in 200414 and was composed of 78 amyloidogenic and 172 non‐amyloidogenic peptides, which are mainly from disease‐related proteins. From that time to the present day, several new datasets that included the previous datasets and newly established peptides, have been published.12, 13, 18, 19 One of the most recently developed and largest database is AmyLoad,20 which contains 444 aggregate‐forming and 1037 non‐forming peptides collected from WALTZ‐DB,21 AmylHex,19 AmylFrag (an extension of AmylHex), data from the Aggrescan12, 13 and TANGO14 papers, in addition to supplementary peptides from the literature. The other recent database, CPAD, contains already known data on amyloid‐forming peptides mentioned above and supplements it by a large amount of data on change in aggregation rate upon mutations.22 The great majority of the sequences in these datasets are short, however, the sequences of proteins and peptides, which form aggregates in vivo or (and) related to diseases, tend to be longer than 15 residues.23, 24 Shorter peptides rarely reach fibril‐forming concentrations in human cells because, once produced, they are rapidly degraded by proteases.25 Along this line, the experiments with fusions of known short amyloidogenic peptides with soluble proteins have yielded unconvincing results, only triggering fibrillation at very high concentrations.26, 27
Thus, known naturally occurring aggregate‐forming proteins that represent the primary interest of the researcher have aggregation‐prone regions that are longer than about 15 residues. In addition, in the monomeric state of these proteins, the aggregation‐prone regions are unfolded and have disordered conformation. Furthermore, these unfolded regions aggregate independently of whether they are alone or in combination with globular domains.28 However, when considering only sequences of 15 residues or longer, the main problem is the limited number of such proteins in the datasets. For example, the datasets of amyloid forming and non‐forming sequences that were collected in the ArchCandy paper11 contained 51 and 64 entries correspondingly. The other recently developed database, AmyLoad,20 has only 85 and 54 sequences.
Hence, there is a lack of experimental data on the naturally occurring aggregate‐forming and non‐forming unfolded proteins, which can be used to benchmark computational prediction algorithms. In this context, we turned our attention to the PDB,29, 30 with about 12,000 protein structures determined by NMR spectroscopy. One of the major conditions for NMR experiments is that the proteins are soluble at very high concentrations (∼1 mM). Moreover, in accordance with NMR data, some of these proteins have their structures flanked by large unfolded terminal regions (see e.g., MobiDB31). As we know the unfolded regions of NMR‐studied proteins do not form aggregates, even at high concentrations, this further suggests that they can be used as a set of experimentally validated non‐aggregative sequences. We present the methodology to build the dataset, the dataset description, and the results of the benchmarking methods for prediction of aggregation versus solubility propensity on this dataset.
Results and Discussion
Methodology of dataset construction
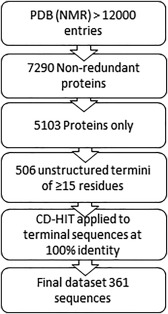
The flowchart of the pipeline that led us to the dataset is schematically outlined in Figure 1. Initially, we downloaded structure and sequence files of all 12,000 entries of solution NMR elucidated proteins from the PDB (Release available on July 25, 2016).29, 30 We then obtained a non‐redundant set of these proteins, using the PDB redundancy filter (at 100% sequence identity defined as number of identical residues out of total in the sequence alignment) amounted to 7290 protein entries. The next step was to verify that each entry contained only proteins and did not contain DNA structures and removing proteins that only had one NMR model, leaving us with 5103 proteins.
Figure 1.

A schematic representation of how we filtered the data to create our dataset.
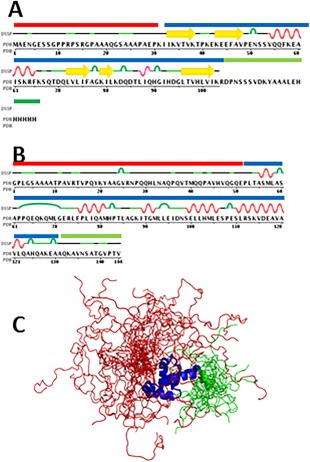
We then determined which residues in the protein structures were unstructured. In general, these unstructured regions can be located either at the termini of the structures, or as flexible loops within the structure. We focused on terminal regions as topologically they have less restraints to form amyloids or aggregates. The terminal regions that lack NMR assignment are most probably flexible/unstructured. There are two types of information, which allow us to select these non‐assigned terminal regions: (1) Frequently, the chains of studied proteins are longer in their sequence files than their structure files [Fig. 2(A)] because the terminal extensions are non‐assigned; (2) NMR structures are built by molecular modeling and dynamics based on experimentally determined restraints. Thus, they are presented as a collection of similar models (usually 20), superposed on each other.29, 30 Terminal regions of PDB entries that lack NMR assignment, are present in the structure, but have very different conformations and cannot be satisfactorily superimposed [Fig. 2(C)].
Figure 2.

Examples of NMR structures highlighting non‐assigned unstructured residues, showing structured residues in blue, unstructured N‐terminal residues in red, and unstructured C‐terminal residues in green. A: Schematic of ubiquitin‐like Domain of hPLIC‐2, 1J8C, having also non‐assigned residues by NMR on the C‐terminus of the sequence that are missing in the file of the structure. B: Schematic of PABC Domain of Human poly(A) binding protein, 1G9L, showing unstructured regions of flexible N‐terminal and C‐terminal residues in red and green, correspondingly. C: PABC Domain of Human poly(A) binding protein, 1G9L, showing unstructured regions of flexible N‐terminal and C‐terminal residues in red and green, correspondingly.
We used a protocol similar to ModFOLDclust2.32, 33 We divided up PDB structure files of each protein into its constitute models (according to the number of NMR models submitted to the PDB), with proteins only having two or more models analyzed. We then superposed all models of a given protein using TM‐align.34 Then, each residue i was scored using an S‐score defined as: Si =1/[1 + (di/d 0)2], where di was the distance between Cα atom of a given residue i in each model and d 0 was the distance threshold (3.9 Å). An Si‐score of 0 was given if di = 3.9 Å (see papers on ModFOLDclust and ModFOLDclust232, 33). The Si values were then summed and the mean score is taken. The mean score is then converted into a distance score in Ångström, using the following equation: .
Based on manual inspection of the superimposed NMR structures, we chose a cut‐off of =12 Å to denote residues that are highly structurally variable [Fig. 2(C)], giving us 574 proteins with the unfolded N‐ and C‐terminal regions that we can analyze. The cut‐off di =12 Å also takes into consideration the fact that globular domains can prevent aggregation due to the steric hindrance between these domains, if the critical aggregation‐prone region starts or ends right after the globular structure. At this cut‐off, the unfolded regions and globular structures have a crosslink of about 3–5 residues between them allowing to avoid the steric hindrance in case of the fibril formation.35
As most of the naturally occurring and disease‐related amyloids are formed by sequences of 15 residues or longer,1 finally, 506 segments of 15 residues or more were considered in this analysis.
During our subsequent manual analysis of the 506 segments of the set, we came across several examples, where the protein with already known 3D structure (such as, e.g., ubiquitin) was attached to a studied protein domain to increase solubility and ease structural elucidation. The “solubilization” domains were present in the sequence files but absent in the structure files. To exclude these cases from our dataset, we used BLAST36 (at 95% sequence ID, e‐value 0.00001, with the terminal fragments of 40 residues long against the CATH database37). We further investigated all BLAST hits manually to determine if the hit was to an actual protein structure. This resulted in the removal of 14 sequences. In addition, all membrane proteins were removed, as they are not soluble by themselves, for NMR studies they are kept in the solution by incorporation into micelles mimicking the membrane (e.g., 2MP3 38). We also revealed that another four protein structures were determined at a pH within the range of the isoelectric point of aspartic acid (pH 3.9) and glutamic acid (pH 4.07). This will result in a change of charge and physico‐chemical properties of these residues to ones similar to asparagine and glutamine, respectfully. For the benchmark, we mutated these residues to asparagine and glutamine.
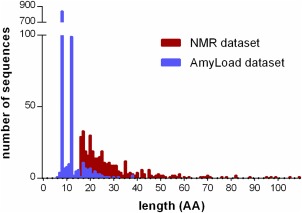
Finally, we carried out clustering of the unfolded terminal protein segments using CD‐HIT39 at a sequence identity of 100%. As a result, we obtained a dataset of the 361 experimentally determined unfolded protein segments of about 15–40 residues that are soluble at high concentrations (see Fig. 3, Supporting Information Data and http://bioinfo.montp.cnrs.fr/index.php?r=NMR‐set). Analysis of the dataset can be found in Supporting Information Figures S1–S3.
Figure 3.

A histogram of the length distributions of the previously known non‐amyloid sequences taken from the AmyLoad database39 (in blue) and our dataset (in red).
Tests of aggregation/solubility prediction algorithms
Our dataset containing 361 sequences can be used to analyze amyloid/aggregate versus solubility prediction algorithms, which can be further used to improve algorithm accuracy. The dataset was analyzed with a number of such algorithms, including Aggrescan,12, 13 TANGO14 and PASTA,16, 17, 40 FoldAmyloid,15 ArchCandy,11 and WALTZ.18 The list of described methods is not exhaustive. Our intention was to cover most of them, selecting those that are the most popular, most original and diverse in terms of the basic principles, and those that can be downloaded or used via web‐servers for a large number of sequences.
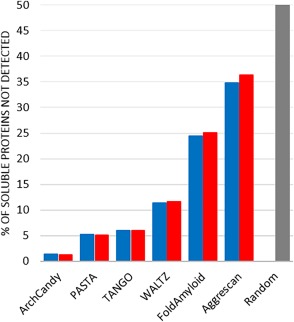
The error rate for amyloid prediction methods ranges in order of best performance from 1.4% (5 sequences) for ArchCandy, PASTA (4.2%, 15 sequences), TANGO (5.0%, 18 sequences), WALTZ (11.4%, 41 sequences), FoldAmyloid (23.3%, 84 sequences), to over 33.5% (121 sequences) for Aggrescan (Fig. 4).
Figure 4.

Benchmarking widely used amyloid/aggregate prediction methods. Blue bars show the percentage of soluble proteins in our NMR‐based dataset not‐detected by the amyloid/aggregate prediction methods. Red bars show the percentage of soluble proteins in our dataset, together with, sequences longer than 15 residues, from the AmyLoad database not‐detected by the amyloid/aggregate prediction methods. The furthermost right gray bar represents the results of a random prediction.
Similar results were obtained when we used 361 sequences from our dataset together with, 54 non‐amyloid sequences, of more than 15 residues from AmyLoad database39 (Fig. 4). Taken separately, the AmyLoad dataset, of 54 sequences, yields the following results: the best performance with 0% (0 sequences) for ArchCandy, followed by PASTA (3.7%, 2 sequences), TANGO (5.6%, 3 sequences), WALTZ (11.0%, 6 sequences), FoldAmyloid (25.9%, 14 sequences), and 42.6% (121 sequences) for Aggrescan.
These results indicate that there is room for improvement of some of the algorithms, with our dataset included in training data. There is a high error rate for methods that use the concept of predicting aggregation propensity of short peptides of about six residues. As already mentioned above, it is problematic as the most common naturally occurring aggregates in a form of amyloid fibres are formed by longer regions.
The unfolded terminal protein sequences of our dataset were clustered at an identity of 100% and this has the potential to result in the over‐representation of some motifs. To alleviate concerns that our dataset can be biased, we also clustered by CD‐HIT39 the unfolded terminal protein segments at a sequence identity of 90%, 80%, 70%, 60%, 50%, and 40%. The benchmark results show that regardless of the sub‐dataset the ranking of the prediction tools remains the same (Table 1).
Table 1.
Number of erroneous predictions for the computational tools Tools by Using Datasets of the Unfolded Terminal Protein Segments at a Sequence Identity of 100%, 90%, 80%, 70%, 60%, 50%, and 40%
| Percentage sequence identity | 100% | 90% | 80% | 70% | 60% | 50% | 40% |
|---|---|---|---|---|---|---|---|
| Total number of sequences | 361 | 345 | 335 | 310 | 286 | 248 | 157 |
| ArchCandy | 5 | 5 | 5 | 5 | 5 | 4 | 4 |
| Pasta | 15 | 14 | 12 | 11 | 11 | 8 | 7 |
| Tango | 18 | 18 | 18 | 18 | 18 | 18 | 14 |
| Waltz | 41 | 37 | 35 | 32 | 28 | 26 | 21 |
| FoldAmyloid | 84 | 78 | 74 | 72 | 64 | 61 | 48 |
| Aggrescan | 121 | 120 | 117 | 117 | 113 | 103 | 85 |
The significant increase of the negative amyloidogenic dataset can drive the improvement of methods for amyloid/aggregate versus solubility prediction and, in particular, the development of machine learning methods. The described methodology of the dataset construction can be the basis of an automated pipeline for regular updates of this dataset, as the number of PDB structures increase. Our dataset can also be incorporated into other existing databases.20, 22 It worth mentioning that although the NMR data does not detect any specific interactions between these unfolded terminal fragments and the corresponding globular domains, strictly speaking, it is appropriate in future to study experimentally some representative sequences from this set to demonstrate that these polypeptides, taken alone, remain soluble.
Supporting information
Supporting Information
Supporting Information
Contributor Information
Daniel B. Roche, Email: daniel.roche@crbm.cnrs.fr.
Andrey V. Kajava, Email: andrey.kajava@crbm.cnrs.fr
References
- 1. Ahmed AB, Kajava AV (2013) Breaking the amyloidogenicity code: methods to predict amyloids from amino acid sequence. FEBS Lett 587:1089–1095. [DOI] [PubMed] [Google Scholar]
- 2. Dobson CM (2001) The structural basis of protein folding and its links with human disease. Philos Trans R Soc London B Biol Sci 356:133–145. [DOI] [PMC free article] [PubMed] [Google Scholar]
- 3. Fandrich M (2012) Oligomeric intermediates in amyloid formation: structure determination and mechanisms of toxicity. J Mol Biol 421:427–440. [DOI] [PubMed] [Google Scholar]
- 4. Otzen D, Nielsen PH (2008) We find them here, we find them there: functional bacterial amyloid. Cell Mol Life Sci 65:910–927. [DOI] [PMC free article] [PubMed] [Google Scholar]
- 5. Thangakani AM, Kumar S, Nagarajan R, Velmurugan D, Gromiha MM (2014) GAP: towards almost 100 percent prediction for beta‐strand‐mediated aggregating peptides with distinct morphologies. Bioinformatics 30:1983–1990. [DOI] [PubMed] [Google Scholar]
- 6. Uversky VN, Fink AL (2004) Conformational constraints for amyloid fibrillation: the importance of being unfolded. Biochim Biophys Acta 1698:131–153. [DOI] [PubMed] [Google Scholar]
- 7. Sanchez de Groot N, Torrent M, Villar‐Pique A, Lang B, Ventura S, Gsponer J, Babu MM (2012) Evolutionary selection for protein aggregation. Biochem Soc Trans 40:1032–1037. [DOI] [PubMed] [Google Scholar]
- 8. Rabouille C, Alberti S (2017) Cell adaptation upon stress: the emerging role of membrane‐less compartments. Curr Opin Cell Biol 47:34–42. [DOI] [PubMed] [Google Scholar]
- 9. Agrawal NJ, Kumar S, Wang X, Helk B, Singh SK, Trout BL (2011) Aggregation in protein‐based biotherapeutics: computational studies and tools to identify aggregation‐prone regions. J Pharm Sci 100:5081–5095. [DOI] [PubMed] [Google Scholar]
- 10. Ventura S, Villaverde A (2006) Protein quality in bacterial inclusion bodies. Trends Biotechnol 24:179–185. [DOI] [PubMed] [Google Scholar]
- 11. Ahmed AB, Znassi N, Chateau MT, Kajava AV (2015) A structure‐based approach to predict predisposition to amyloidosis. Alzheimers Dement 11:681–690. [DOI] [PubMed] [Google Scholar]
- 12. Conchillo‐Sole O, de Groot NS, Aviles FX, Vendrell J, Daura X, Ventura S (2007) AGGRESCAN: a server for the prediction and evaluation of “hot spots” of aggregation in polypeptides. BMC Bioinformatics 8:65. [DOI] [PMC free article] [PubMed] [Google Scholar]
- 13. de Groot NS, Castillo V, Grana‐Montes R, Ventura S (2012) AGGRESCAN: method, application, and perspectives for drug design. Methods Mol Biol 819:199–220. [DOI] [PubMed] [Google Scholar]
- 14. Fernandez‐Escamilla AM, Rousseau F, Schymkowitz J, Serrano L (2004) Prediction of sequence‐dependent and mutational effects on the aggregation of peptides and proteins. Nat Biotechnol 22:1302–1306. [DOI] [PubMed] [Google Scholar]
- 15. Garbuzynskiy SO, Lobanov MY, Galzitskaya OV (2010) FoldAmyloid: a method of prediction of amyloidogenic regions from protein sequence. Bioinformatics 26:326–332. [DOI] [PubMed] [Google Scholar]
- 16. Trovato A, Seno F, Tosatto SC (2007) The PASTA server for protein aggregation prediction. Protein Eng Des Sel 20:521–523. [DOI] [PubMed] [Google Scholar]
- 17. Walsh I, Seno F, Tosatto SC, Trovato A (2014) PASTA 2.0: an improved server for protein aggregation prediction. Nucleic Acids Res 42:W301–W307. [DOI] [PMC free article] [PubMed] [Google Scholar]
- 18. Maurer‐Stroh S, Debulpaep M, Kuemmerer N, Lopez de la Paz M, Martins IC, Reumers J, Morris KL, Copland A, Serpell L, Serrano L, Schymkowitz JW, Rousseau F (2010) Exploring the sequence determinants of amyloid structure using position‐specific scoring matrices. Nat Methods 7:237–242. [DOI] [PubMed] [Google Scholar]
- 19. Thompson MJ, Sievers SA, Karanicolas J, Ivanova MI, Baker D, Eisenberg D (2006) The 3D profile method for identifying fibril‐forming segments of proteins. Proc Natl Acad Sci USA 103:4074–4078. [DOI] [PMC free article] [PubMed] [Google Scholar]
- 20. Wozniak PP, Kotulska M (2015) AmyLoad: website dedicated to amyloidogenic protein fragments. Bioinformatics 31:3395–3397. [DOI] [PubMed] [Google Scholar]
- 21. Beerten J, Van Durme J, Gallardo R, Capriotti E, Serpell L, Rousseau F, Schymkowitz J (2015) WALTZ‐DB: a benchmark database of amyloidogenic hexapeptides. Bioinformatics 31:1698–1700. [DOI] [PubMed] [Google Scholar]
- 22. Thangakani AM, Nagarajan R, Kumar S, Sakthivel R, Velmurugan D, Gromiha MM (2016) CPAD, Curated Protein Aggregation Database: a repository of manually curated experimental data on protein and peptide aggregation. PLoS One 11:e0152949. [DOI] [PMC free article] [PubMed] [Google Scholar]
- 23. Pepys MB (2006) Amyloidosis. Annu Rev Med 57:223–241. [DOI] [PubMed] [Google Scholar]
- 24. Kajava AV, Baxa U, Steven AC (2010) Beta arcades: recurring motifs in naturally occurring and disease‐related amyloid fibrils. FASEB J 24:1311–1319. [DOI] [PMC free article] [PubMed] [Google Scholar]
- 25. Saveanu L, Fruci D, van Endert P (2002) Beyond the proteasome: trimming, degradation and generation of MHC class I ligands by auxiliary proteases. Mol Immunol 39:203–215. [DOI] [PubMed] [Google Scholar]
- 26. Guo Z, Eisenberg D (2008) The structure of a fibril‐forming sequence, NNQQNY, in the context of a globular fold. Protein Sci 17:1617–1623. [DOI] [PMC free article] [PubMed] [Google Scholar]
- 27. Esteras‐Chopo A, Serrano L, Lopez de la Paz M (2005) The amyloid stretch hypothesis: recruiting proteins toward the dark side. Proc Natl Acad Sci USA 102:16672–16677. [DOI] [PMC free article] [PubMed] [Google Scholar]
- 28. Baxa U, Taylor KL, Wall JS, Simon MN, Cheng N, Wickner RB, Steven AC (2003) Architecture of Ure2p prion filaments: the N‐terminal domains form a central core fiber. J Biol Chem 278:43717–43727. [DOI] [PubMed] [Google Scholar]
- 29. Berman HM, Battistuz T, Bhat TN, Bluhm WF, Bourne PE, Burkhardt K, Feng Z, Gilliland GL, Iype L, Jain S, Fagan P, Marvin J, Padilla D, Ravichandran V, Schneider B, Thanki N, Weissig H, Westbrook JD, Zardecki C (2002) The Protein Data Bank. Acta Crystallogr DBiol Crystallogr58:899–907. [DOI] [PubMed] [Google Scholar]
- 30. Berman HM, Westbrook J, Feng Z, Gilliland G, Bhat TN, Weissig H, Shindyalov IN, Bourne PE (2000) The Protein Data Bank. Nucleic Acids Res 28:235–242. [DOI] [PMC free article] [PubMed] [Google Scholar]
- 31. Potenza E, Di Domenico T, Walsh I, Tosatto SC (2015) MobiDB 2.0: an improved database of intrinsically disordered and mobile proteins. Nucleic Acids Res 43:D315–D320. [DOI] [PMC free article] [PubMed] [Google Scholar]
- 32. McGuffin LJ (2007) Benchmarking consensus model quality assessment for protein fold recognition. BMC Bioinformatics 8:345. [DOI] [PMC free article] [PubMed] [Google Scholar]
- 33. McGuffin LJ, Roche DB (2010) Rapid model quality assessment for protein structure predictions using the comparison of multiple models without structural alignments. Bioinformatics 26:182–188. [DOI] [PubMed] [Google Scholar]
- 34. Zhang Y, Skolnick J (2005) TM‐align: a protein structure alignment algorithm based on the TM‐score. Nucleic Acids Res 33:2302–2309. [DOI] [PMC free article] [PubMed] [Google Scholar]
- 35. Kajava AV, Baxa U, Wickner RB, Steven AC (2004) A model for Ure2p prion filaments and other amyloids: the parallel superpleated beta‐structure. Proc Natl Acad Sci USA 101:7885–7890. [DOI] [PMC free article] [PubMed] [Google Scholar]
- 36. Altschul SF, Gish W, Miller W, Myers EW, Lipman DJ (1990) Basic local alignment search tool. J Mol Biol 215:403–410. [DOI] [PubMed] [Google Scholar]
- 37. Greene LH, Lewis TE, Addou S, Cuff A, Dallman T, Dibley M, Redfern O, Pearl F, Nambudiry R, Reid A, Sillitoe I, Yeats C, Thornton JM, Orengo CA (2007) The CATH domain structure database: new protocols and classification levels give a more comprehensive resource for exploring evolution. Nucleic Acids Res 35:D291–D297. [DOI] [PMC free article] [PubMed] [Google Scholar]
- 38. Lim L, Lee X, Song J (2015) Mechanism for transforming cytosolic SOD1 into integral membrane proteins of organelles by ALS‐causing mutations. Biochim Biophys Acta 1848:1–7. [DOI] [PubMed] [Google Scholar]
- 39. Li W, Godzik A (2006) Cd‐hit: a fast program for clustering and comparing large sets of protein or nucleotide sequences. Bioinformatics 22:1658–1659. [DOI] [PubMed] [Google Scholar]
- 40. Trovato A, Chiti F, Maritan A, Seno F (2006) Insight into the structure of amyloid fibrils from the analysis of globular proteins. PLoS Comput Biol 2:e170. [DOI] [PMC free article] [PubMed] [Google Scholar]
Associated Data
This section collects any data citations, data availability statements, or supplementary materials included in this article.
Supplementary Materials
Supporting Information
Supporting Information


