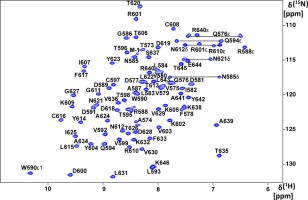
Figure 1.

2D [15N,1H]‐HSQC spectrum of the HKU9 C domain. 1.2 mM 15N‐labeled HKU9 C in a 20 mM sodium phosphate (pH = 6.0), 150 mM NaCl, 3% d10‐DTT, 0.02% (w/v) NaN3 solution was measured on a Bruker Avance III 600MHz spectrometer. Backbone 15N–1H correlation peaks are indicated by single letter amino acid nomenclature. Arg and Trp assigned 15N‐1Hε correlation peaks are labeled. The amide side chain 15N–1H2 signals from Asn and Gln are shown with horizontal lines
