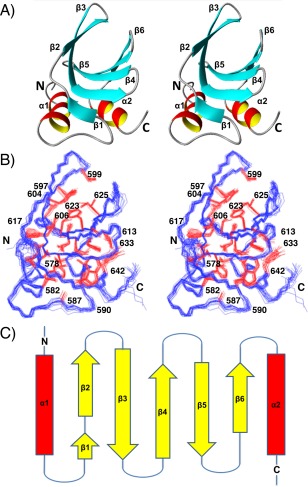
Figure 2.

NMR solution structure of the HKU9 C domain. Wall‐eye stereo views are shown. (A) Ribbon representation of the representative conformer (nearest to the mean coordinates of the ensemble). Secondary structures are labeled. (B) Line representation of the 20‐conformer ensemble. The polypeptide backbone (blue) and selected side chains with solvent accessibility below 15% (red) are shown. (C) Topology diagram of HKU9‐C. The α‐helices (red) are indicated by rectangles and the β‐sheets (yellow) are indicated by arrows
