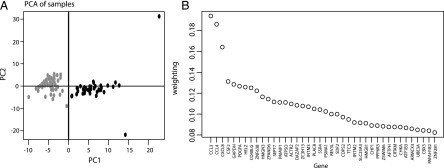
FIGURE 3.
Results of single-cell RNA sequencing. (A) PC analysis of expression data. Each point represents a sample whose expression data has been projected onto the first two PCs for the expression data subset that includes all genes with statistically significant differential expression. (B) Genes providing the largest contribution to weightings for PC1.

