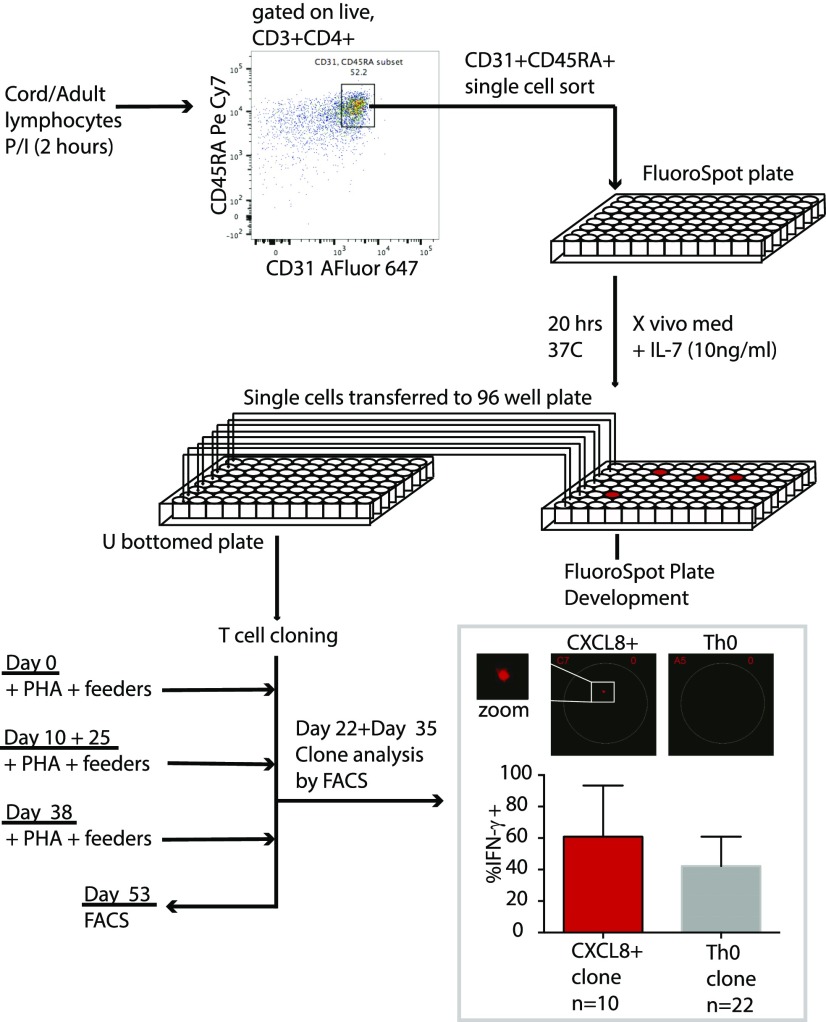
FIGURE 5.
Schematic diagram demonstrating how single-cell sorting in FluoroSpot plates was performed. Inset: production of IFN-γ is shown for 10 clones derived from CXCL8+ cells and 22 clones derived from Th0 cells, with a representative FluoroSpot well shown above for a CXCL8+ well and a Th0 well. Clones were harvested after sufficient cell numbers had been reached and were stimulated with PI for 4 h prior to staining and acquisition.

