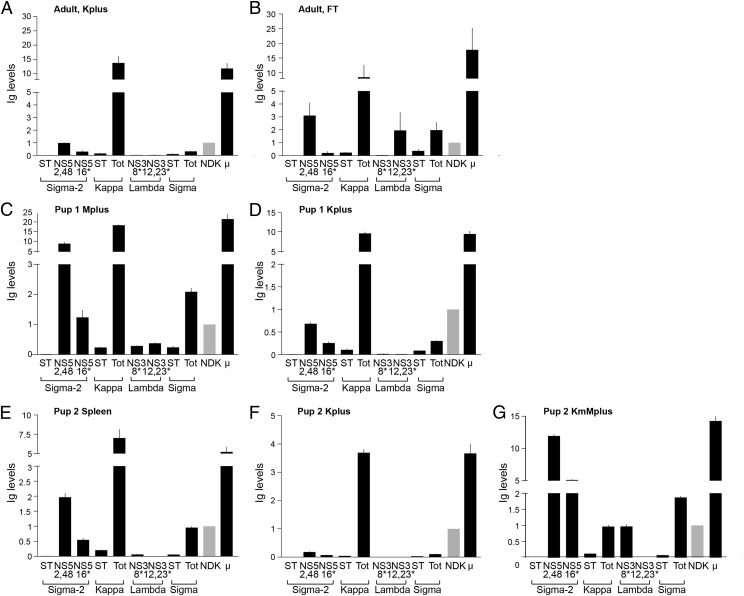
FIGURE 2.
Relative L chain transcript levels in splenocyte subpopulations. DNase-treated mRNA samples were analyzed for σ-2, κ, λ, σ, and μ sequences. GL-joined σ-2 and λ genes are named and designated with an asterisk. Graphs show Ig levels normalized to NDK (fold increase to NDK, 2−ΔΔCt); NDK level is shown in gray. (A) Adult, Kplus are the sIgκ+ splenocytes. (B) Adult, FT is FT of the anti-κ column. (C) Pup1, Mplus are the sIgM+ splenocytes. (D) Pup1, Kplus. (E) Pup2, total spleen mRNA. (F) Pup2, Kplus. (G) Pup2, KmMplus. After two depletions of sIgκ+ splenocytes, sIgM+ cells were obtained from the second FT.

