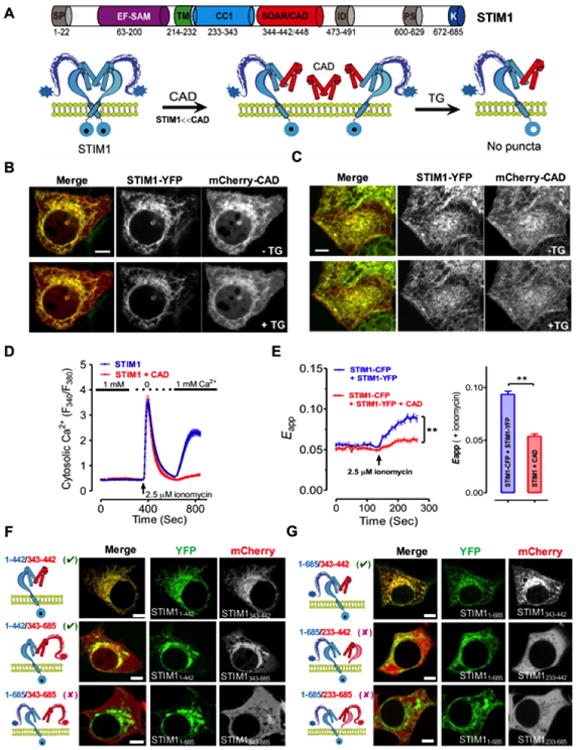
Fig. 3. SOAR/CAD forms heterodimer with full length STIM1 to modulate STIM1 activation.

(A) A proposed model for the formation of possible CAD/STIM1 heteromeric complexes before and after TG-induced store depletion. When CAD is more abundant than STIM1, CAD may compete with STIM1 homodimer to form CAD:STIM1 heterodimer, but this may prevent the activation of a monomeric STIM1 in the heterodimer due to lack of signal transduction (requiring concerted efforts of TMs and CC1s from another copy of STIM1) across the ER membrane after store depletion. Therefore, puncta formation and Ca2+ response will be counter-intuitively suppressed.
(B-C) Confocal images of the middle planes (B) and footprints (C) of HeLa cells co-expressing STIM1-YFP and excessive amounts of mCherry-CAD constructs before (upper) and after (lower) store depletion induced by 1 μM TG. Scale bar, 5 μm.
(D) Ca2+ responses in HEK293 cells with overexpressed STIM1 alone (blue) or STIM1-YFP-T2A-mCherry-CAD (red) monitored by Fura-2 fluorescence ratio. The solid bar above the curves indicates 1 mM Ca2+ in the external medium.
(E) FRET signals in HEK293 cells co-expressing STIM1-CFP and STIM1-YFP, in the presence (red) or absence (blue) of excessive amounts of mCherry-CAD. Store depletion was induced by 2.5 μM ionomycin. The FRET signals after store depletion were plotted as bar graph. **P 0.01, paired Student's t-test.
(F) The combinations of possible STIM1 heterodimers tested in the colocalization assay (left) and confocal images of HeLa cells co-expressing STIM11-442-YFP or STIM1-YFP (middle) with the indicated mCherry-tagged STIM1 fragments (STIM1343-442 orSTIM1343-685; right). Scale bar, 5 μm.
(G) Constructs used for the colocalization assay (left) and confocal images of HeLa cells co-expressing STIM1-YFP (middle with the indicated STIM1 fragments: mCherry-STIM1343-442, mCherry-STIM1233-442, or mCherry-STIM1233-685 (right). Scale bar, 5 μm.
