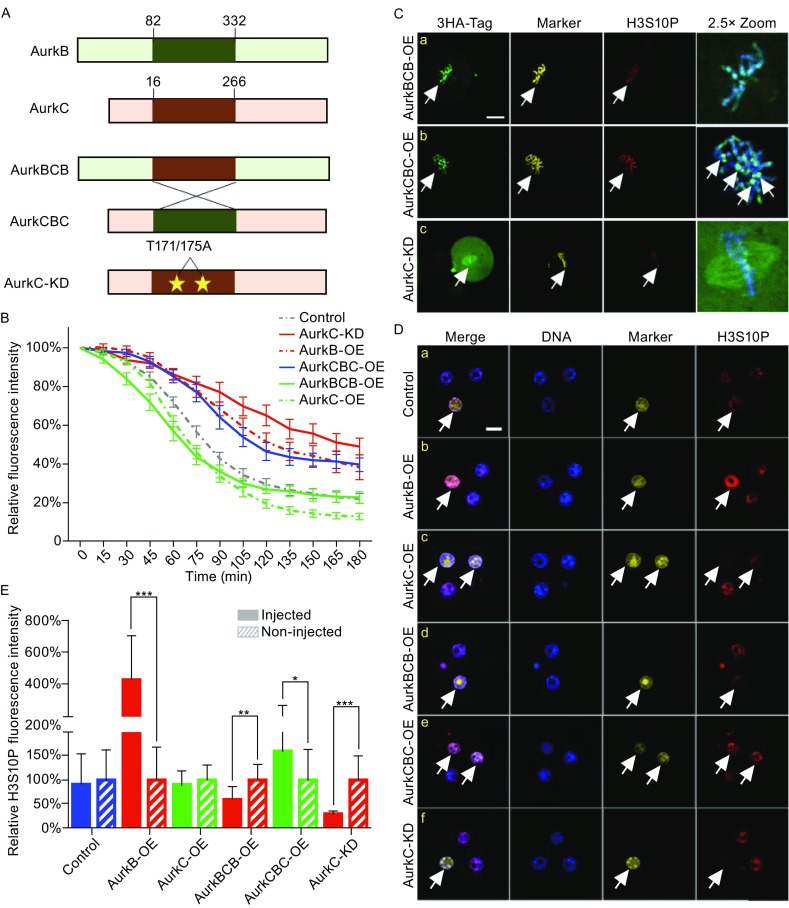
Figure 2.

The kinase domain of AurkB and AurkC determined their biological activity. (A) Schematic view of the domain structure of AurkB, C, CBC, BCB, and kinase deficient AurkC-KD. (B) The Securin-mCherry fluorescence (Y-axis) degradation curve in AurkBCB-OE (n = 21), AurkCBC-OE (n = 22), and AurkC-KD (n = 26) groups, from NEBD to sister chromatids separation. Y-axis, fluorescence intensity; X-axis, time (min). The continuous line and whiskers indicate means and SEM. (C) 3HA-AurkBCB, CBC, and AurkC-KD localization during 2–4 cell stage division. DNA (blue), 3HA-tag (green), H2B-GFP (yellow), H3S10P (red). Scale bar, 20 μm. (D) H3S10P immunostaining of 4-cell stage embryos in the control (n = 26), AurkB-OE (n = 28), AurkC-OE (n = 24), AurkBCB-OE (n = 30), AurkCBC-OE (n = 22), and AurkC-KD (n = 24) groups. DNA (blue), H2B-GFP (marker, yellow), H3S10P (red). Scale bars, 20 μm. (E) Relative fluorescence intensity of H3S10P in injected and no injected cells. Control (n = 26), AurkB-OE (n = 28), AurkC-OE (n = 24), AurkBCB-OE (n = 30), AurkCBC-OE (n = 22), and AurkC-KD (n = 24) groups. The bar and whiskers indicate means and SD, *P < 0.05, **P < 0.01, ***P < 0.001
