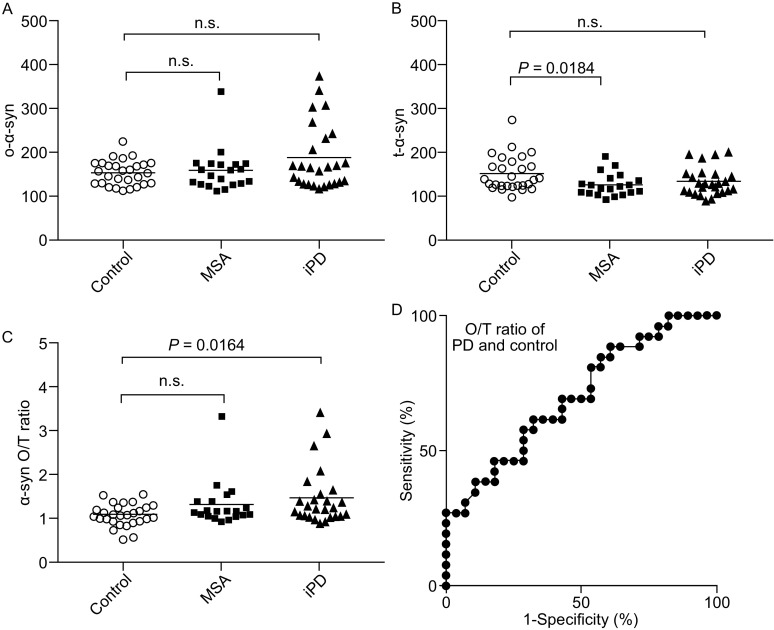
Figure 2.
AlphaLISA assays detection of CSF α-syn in human patients. (A) Comparison of the oligomer α-syn between PD, MSA, and control patients. (B) Comparison of the total α-syn between PD, MSA, and control patients. (C) Comparison of the O/T ratio between PD, MSA, and control patients. (D) Receiver operating curves (ROC) for the levels of O/T in the patients tested CSF. All PD and control patients were concluded for ROC analysis, the area under curve (AUC) = 0.701. For Figure 2A–C, scatterplots representing individual sample values (means of 3 technical replicates). Each bar represents the mean value. PD = Parkinson’s disease, MSA = multiple system atrophy

