Fig. 3.
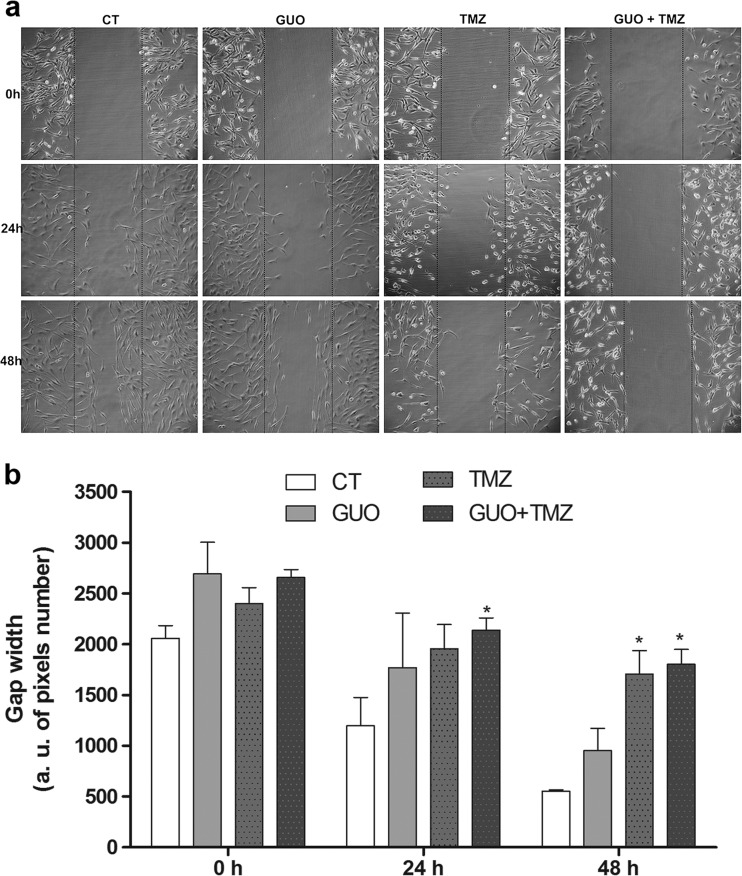
GUO and TMZ effects on A172 glioma cell migration. After confluence, cells were treated (GUO—500 μM; TMZ—500 μM; GUO 500 μM + TMZ 500 μM), the scratch assay was performed, and the cells photographed subsequently after 24 and 48 h. a Illustrative images from cells subjected to the scratched protocol and evaluated after 0, 24, and 48 h, scale bar—200 μm. b Gap width was quantified as arbitrary units of pixel number on Image J Software. n = 3 of independent experiments. *p < 0.05 compared to the same time control group

