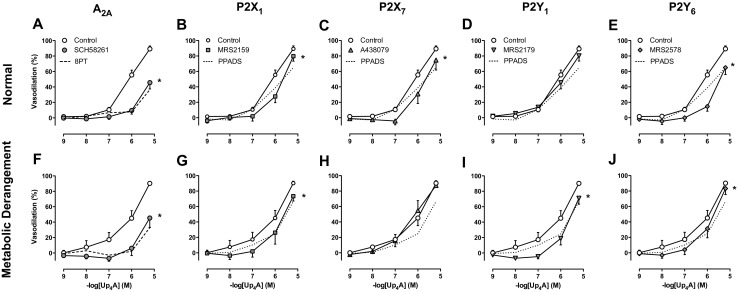
Fig. 3.

Involvement of purinergic receptor subtypes in Up4A-induced relaxation. Shown are concentration responses to Up4A (10−9–10−5 M) in porcine coronary small arteries in control vessels (normal, n = 13; metabolic derangement, n = 7) and in the presence of 100 nM A2A receptor antagonist SCH58261 (normal (n = 8, panel a); metabolic derangement (n = 7, panel f)); in the presence of 30 μM P2X1 receptor antagonist MRS2159 (normal (n = 6, panel b); metabolic derangement (n = 7, panel g)); in the presence of 10 μM P2X7 receptor antagonist A438079 (normal (n = 7, panel c); metabolic derangement (n = 6, panel h)); in the presence of 1 μM P2Y1 receptor antagonist MRS2179 (normal (n = 9, panel d); metabolic derangement (n = 7, panel i)); and in the presence of 10 μM P2Y6 receptor antagonist MRS2578 (normal (n = 6, panel e); metabolic derangement (n = 6, panel j)). For the sake of comparison, non-selective P1 blockade with 8PT (normal, n = 10; metabolic derangement, n = 6) is shown as dotted line in panels a and f, while non-selective P2 blockade with PPADS (normal, n = 5; metabolic derangement, n = 7) is shown as dotted line in panels b, c, d, e, g, h, i, and j. Values are mean ± SEM. *P < 0.05 vs. control
