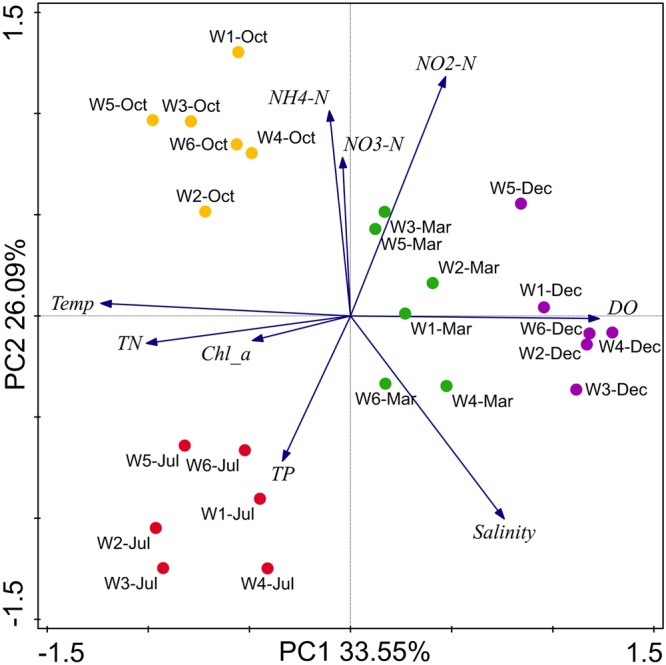
FIGURE 2.

Biplot of the principal component analysis (PCA) for environmental parameters in the sampling stations near Qinhuangdao coastal area. The two principal components (PC1 and PC2) explained 59.64% of total variation in environmental data, and shows clear partitioning of July and October samples from December and March along the PC1, and partitioning of July from October along PC2. PC1 and PC2 strongly correlated to variables NH4-N and NO3-N, and total nitrogen (TN), temperature (T) and Chlorophyll-a (Chl a), respectively. Total phosphate (TP), NO2-N, and salinity were not correlated to PC1 and PC2. Blue arrows represent environmental parameters, and circles in color represents sampling points.
