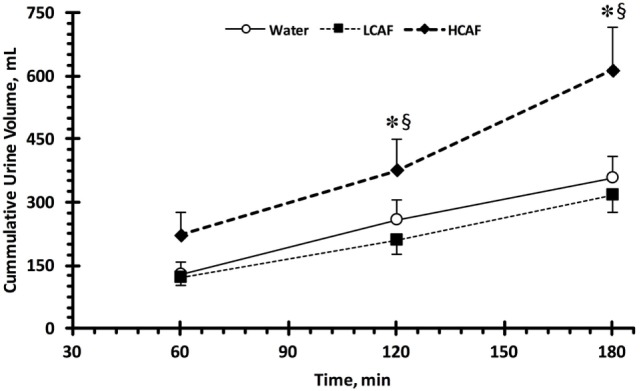
Figure 1.

Cumulative urinary output during the three trials. Low caffeine (LCAF) intake (3 mg kg−1); high caffeine (HCAF) intake (6 mg kg−1). Error bars depict SEM. * denotes statistically significant different from water trial during the same time-point. § denotes statistically significant different from LCAF trial during the same time-point.
