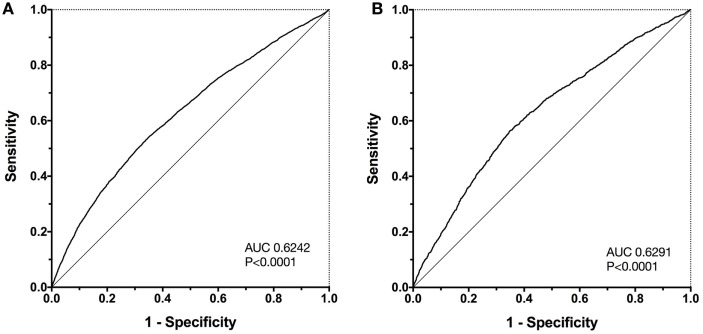
Figure 6.
Receiver operating characteristic (ROC) curves for the survival probabilities as calculated by the final four-parameter multivariable model. Panel (A) displays the ROC curve for the initial population (n = 33,117). The area under the ROC curve (AUC) is 0.6242, significantly different from 0.5 (P < 0.0001). The same multivariable model was then used to predict outcomes in a separate test population of dogs from the same institution (n = 11,249), panel (B). In the test population, the AUC was almost identical to that in the original population AUC 0.6291, significantly different from 0.5 (P < 0.0001).

