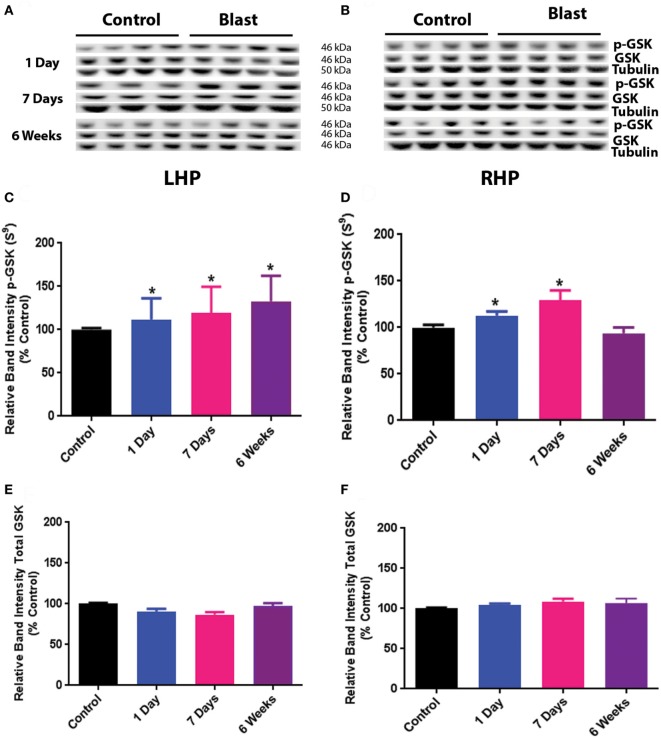
Figure 2.
Effect of primary blast (25 psi) on GSK3β phosphorylation in the rat hippocampus. Data show the results obtained from the ipsilateral (A,C,E) and contralateral (B,D,F) sides of the hippocampus relative to shock wave exposure. (A,B) Representative western blot bands from control and blasted rat hippocampal homogenates. Each lane under both control and blast represents a separate animal in their respective groups. (C,D) Relative band intensity of pGSK3β S9 at various times after primary blast exposure. (C,F) Relative band intensity of total GSK3β at various times after primary blast exposure. Mean ± SEM from at least four different rats. *P < 0.05, **P < 0.01, compared with control. LHP, left hippocampus; RHP, right hippocampus.

