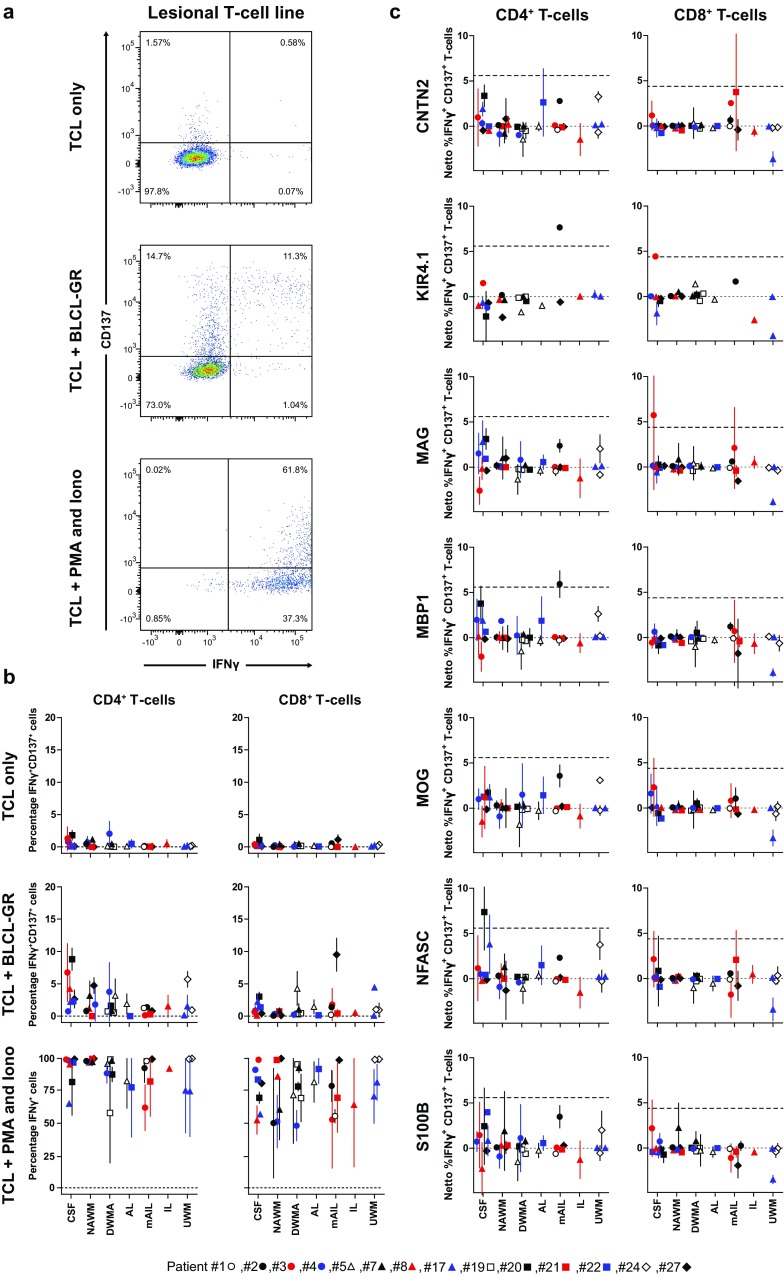
Fig. 6.
T-cell lines generated from paired cerebrospinal fluid and white matter brain tissue of MS patients show no substantial T-cell reactivity towards candidate human MS-associated autoantigens. Short-term T-cell lines (TCL) were generated by non-specific stimulation of T cells recovered from paired cerebrospinal fluid (CSF) and white matter brain tissues from 14 MS patients, which were immunohistologically classified as normal-appearing white matter (NAWM), diffuse white matter abnormalities (DWMA), active lesions (AL), mixed active/inactive lesions (mAIL), inactive lesions (IL) or undefined white matter tissue (UWM) (see Online Resource 3 for criteria applied for MS WM classification). An HLA-matched Epstein–Barr virus-transformed B-cell line (i.e., BLCL-GR) was used to assay T-cell reactivity towards candidate human MS-associated autoantigens (cMSAg). a Antigen-specific T cells were enumerated by determining co-expression of intracellular interferon gamma (IFNγ) and CD137 using multiplex flow cytometry. Gated CD8+ T cells from mAIL-derived TCL of MS patient #27 (see Online Resource 1) is representatively shown. CD8+ T cells alone (top panel), stimulated with untransduced BLCL-GR (middle panel) or with phorbol myristate-acetate (PMA) and ionomycin (Iono) are shown. b The frequency of IFNγ and CD137 co-expressing CD4+ (left panel) and CD8+ T cells (right panels) that were cultured alone (top panels) or co-cultured with untransduced BLCL-GR (middle panels) are shown. The bottom panel shows the frequency of IFNγ-expressing CD4+ (left panel) and CD8+ T cells (right panel) after stimulation with a cocktail of T-cell mitogens (i.e., PMA and Iono). c BLCL-GR were nucleofected with human candidate MS autoantigens (cMSAg) expression vectors encoding human contactin-2 (CNTN2), inwards rectifying potassium channel (KIR4.1), myelin-associated glycoprotein (MAG), myelin basic protein isoform 1 (MBP1), myelin oligodendrocyte glycoprotein (MOG), neurofascin (NFASC) or S100 calcium-binding protein B (S100B). TCL were co-cultured with the respective cMSAg-expressing BLCL-GR and the phenotype and frequency of cMSAg-specific T cells determined by flow cytometry. The netto frequency of cMSAg-specific T cells, corrected for reactivity towards untransduced BLCL-GR, is shown as the percentage IFNγ+CD137+ CD4+ (left panel) and CD8+ T cells (right panel). Symbols represent the individual MS patients analyzed (n = 14; specified at the bottom of the figure). The majority of TCL were assayed at least two times, of which vertical lines represent the mean and standard deviation. Horizontal dashed lines depict the cut-off for positive calls for CD4+ and CD8+ T cells, allowing a 0.1% false discovery. Significance of variation in cMSAg-specific T-cell reactivity was determined by ANOVA for CD4+ and CD8+ T cells separately

