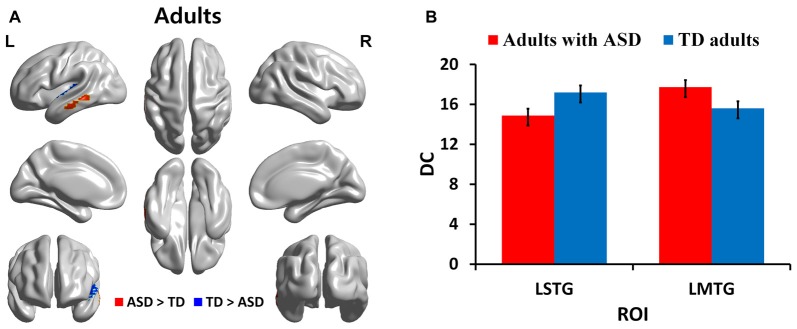
Figure 3.
DC in regions with significant differences between adults with ASD and TD adults. (A) Regions with significant (p < 0.05, corrected) difference are represented in red (ASD > TD) and blue (TD > ASD) for adults. (B) Bar charts show DC values of regions for which there are significant differences in adults with ASD and TD adults. The ASD group is displayed in red and the TD group in blue with error bar. L, left; STG, superior temporal gyrus; MTG, middle temporal gyrus.

