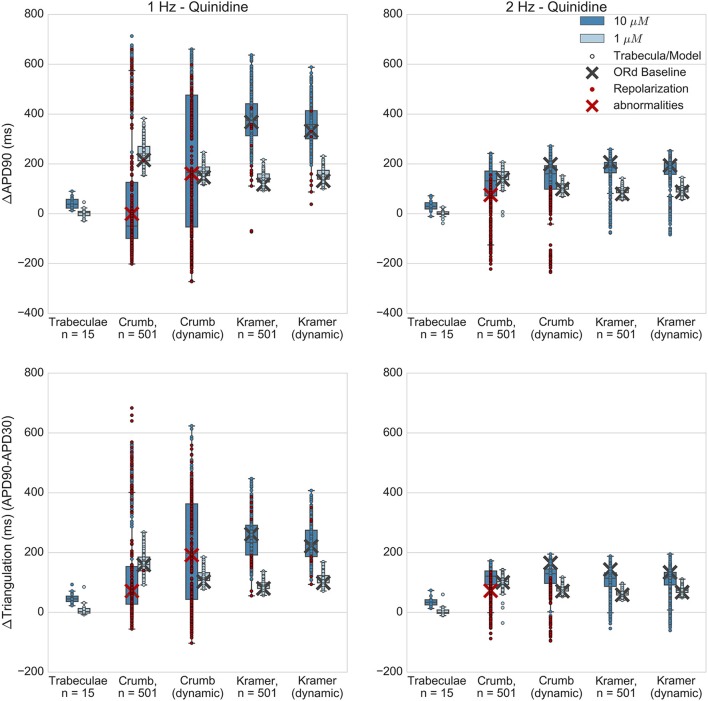
Figure 7.
Quinidine. Changes to APD90 and triangulation relative to control from application of 1 and 10 μM quinidine during 1 and 2 Hz pacing. In each panel, response is shown for (left to right): human ventricular trabeculae, populations of models using drug effects calculated using data from Crumb et al. from Crumb et al. with IKr replaced by the Li et al. IKr model; from Kramer et al.; and from Kramer et al. with IKr replaced by the Li et al. IKr model. Dots indicate results from individual trabeculae and models, crosses show the result from the baseline ORd model. Red symbols indicate simulations and experiments where repolarization abnormalities occurred.

