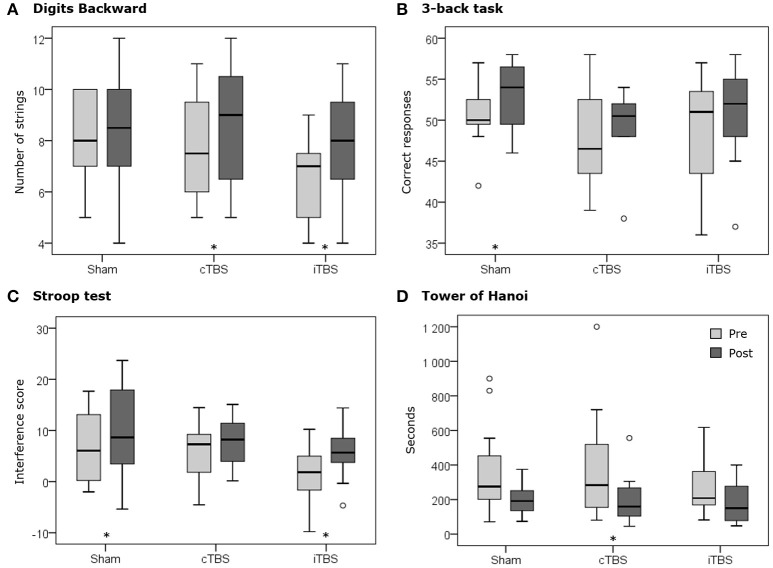
Figure 5.
Boxplots representing the pre (pale gray) and post (dark gray) distributions of each stimulation condition (i.e., sham, cTBS and iTBS) for (A) the number of strings completed in the Digits Backward test, (B) the number of correct responses in the 3-back task, (C) the interference score of the Stroop test, and (D) the time to complete the Tower of Hanoi. The asterisks (*) represent statistically significant differences (p < 0.05) between pre- and post-TBS assessment in specific conditions and tests. Circles (°) represent outliers.

