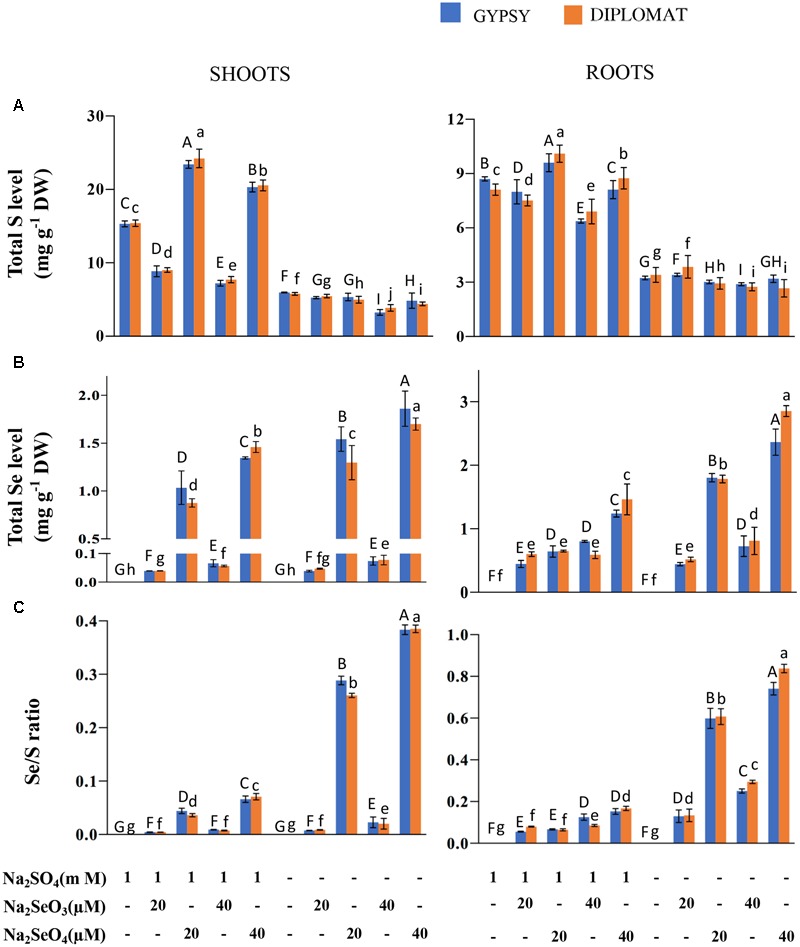
FIGURE 2.

Total S and Se levels and Se/S ratio in two cultivars of broccoli subjected to different forms and levels of Se treatment with and without S supplementation. (A) Total S levels in shoots and roots of plants treated for 2 weeks. (B) Total Se levels in shoots and roots of plants treated for 2 weeks. (C) Se/S ratios that were calculated with total Se levels divided by total S levels. Data represents means from four independent biological replicates. Error bars indicate ±SE. Different letters above the columns indicate significant differences at p < 0.05 by Duncan’s multiple range test.
