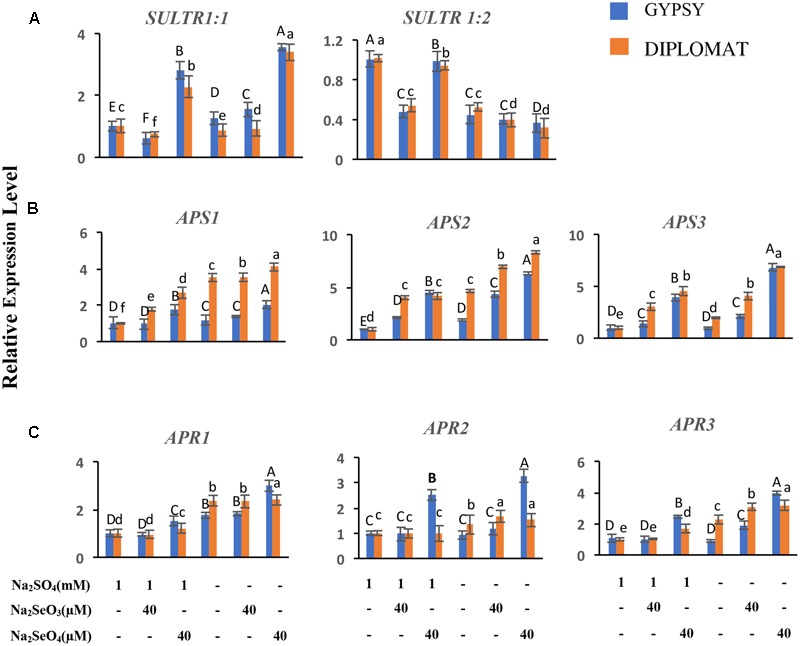
FIGURE 6.

Relative expression of genes involved in S/Se transport and assimilation in broccoli following various Se/S treatments for 2 weeks. (A) Transcript levels of S transporters in roots. (B,C) Transcript levels of APS and APR genes in leaves. The expression levels were measured by qRT-PCR. The expression of genes in non-treated samples with 1 mM of sulfate supplementation was set to 1. Data are means of three biological replicates with two technical trials each. Error bars indicate ±SE. Different letters above the columns indicate significantly different according to Duncan’s multiple range test at p < 0.05.
