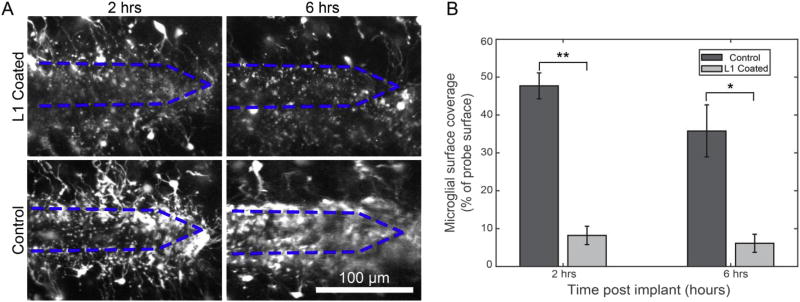
Fig. 4.
L1 coating continues to prevent microglial surface coverage through 6 h post-implant. A) 2D projections of probes at 2 and 6 h post-implant B) The percentage of the probe’s surface that was covered by microglia was significantly less for L1-coated probes compared to control probes at 2 h and 6 h post-implant (Welch’s T-test; **p < 0.001, *p < 0.05). Bar graph data presented as mean ± SEM.

