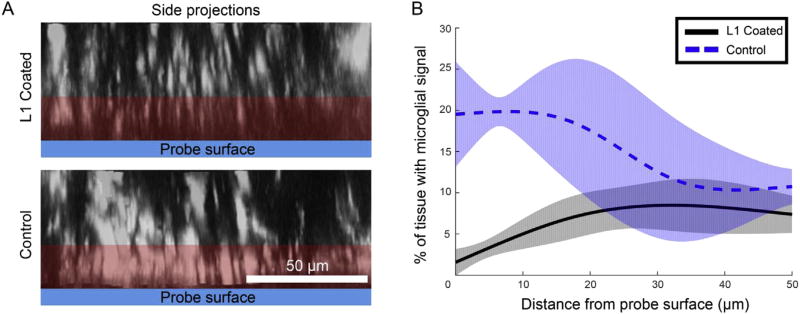
Fig. 5.
Decreases in the % of tissue with microglial signal adjacent to L1 coated probes. A) Side projections of Z stacks allow the microglial signal in the Z-direction above probes to be measured. The red region indicates where there are significant differences between groups. B) % of tissue with microglial signal data was modeled with a linear mixed model for the L1 group (black, solid line) and control group (blue, dotted line). The likelihood ratio test revealed significant group wise differences (p < 0.0001), with 95% confidence intervals (shaded aspects of traces) diverging at 20 min post-implant. (For interpretation of the references to colour in this figure legend, the reader is referred to the web version of this article.)

