FIGURE 5.
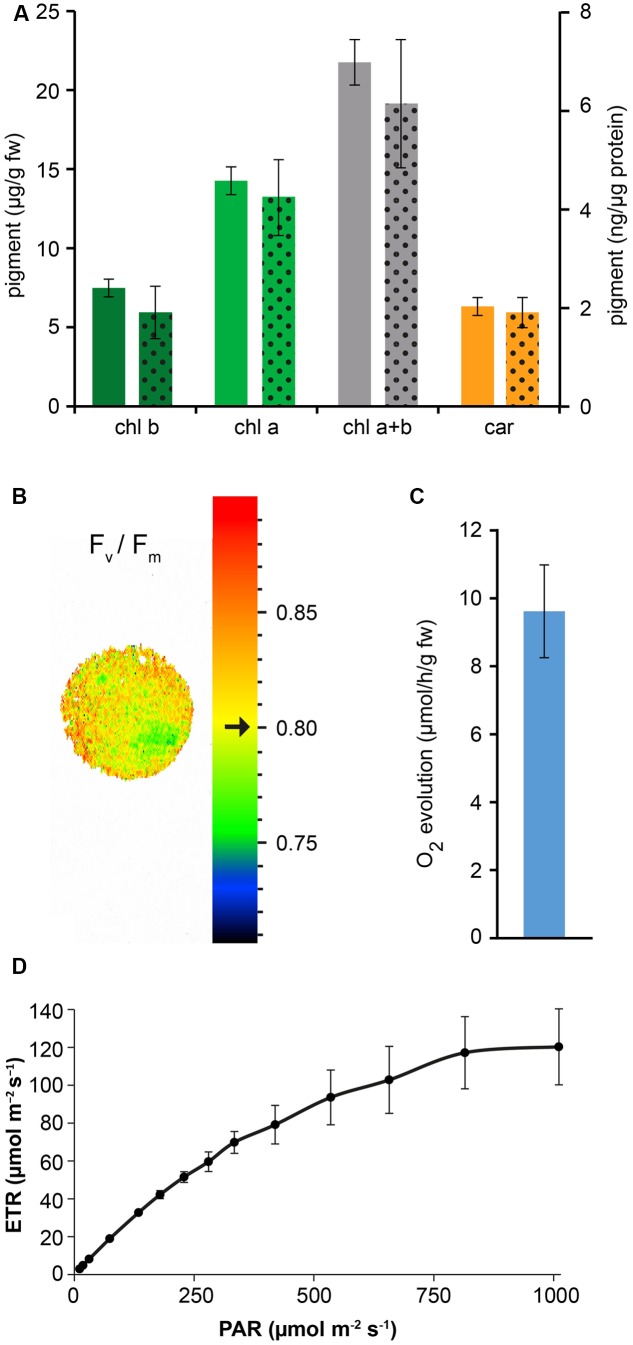
Measurement of photosynthetic pigment content and photosynthetic activity of Arabidopsis cell suspension cultures. (A) Quantitative analysis of chlorophyll b (chl b), chlorophyll a (chl a) and total carotenoids (car). Full column values refer to the y axis on the left, dotted column values refer to the y axis on the right. Data are the means ± SE (n = 5). (B) PAM imaging analysis demonstrated a very good maximum quantum yield of photosystem II. Black arrow indicates a Fv/Fm mean value of 0.80 ± 0.01 (n = 3), representative for the displayed sample spot. (C) Quantitative analysis of O2 evolution. Data are the means ± SE (n = 8). (D) Electron transport rate (ETR) at PSII. Data are the means ± SE (n = 3).

