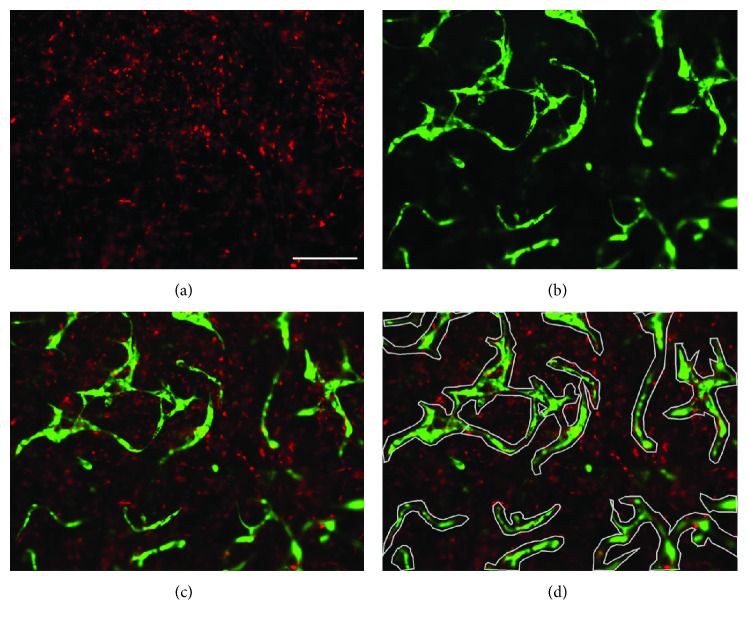
Figure 1.
Network analysis. Image analysis method of PRP gels (seeding density: 2.5 × 10³ cells/μl gel) with encapsulated PKH26 Red-labeled MSCs and GFP-HUVECs (green). Shown are representative pictures of a 50% HUVEC–50% MSC coculture after 14 days of culture. (a) Red-labeled MSCs, (b) GFP-labeled HUVECs, and (c) combined image. (d) Tubular structures are marked with the polygons (grey). Scale bar = 200 μm.

