Figure 4.
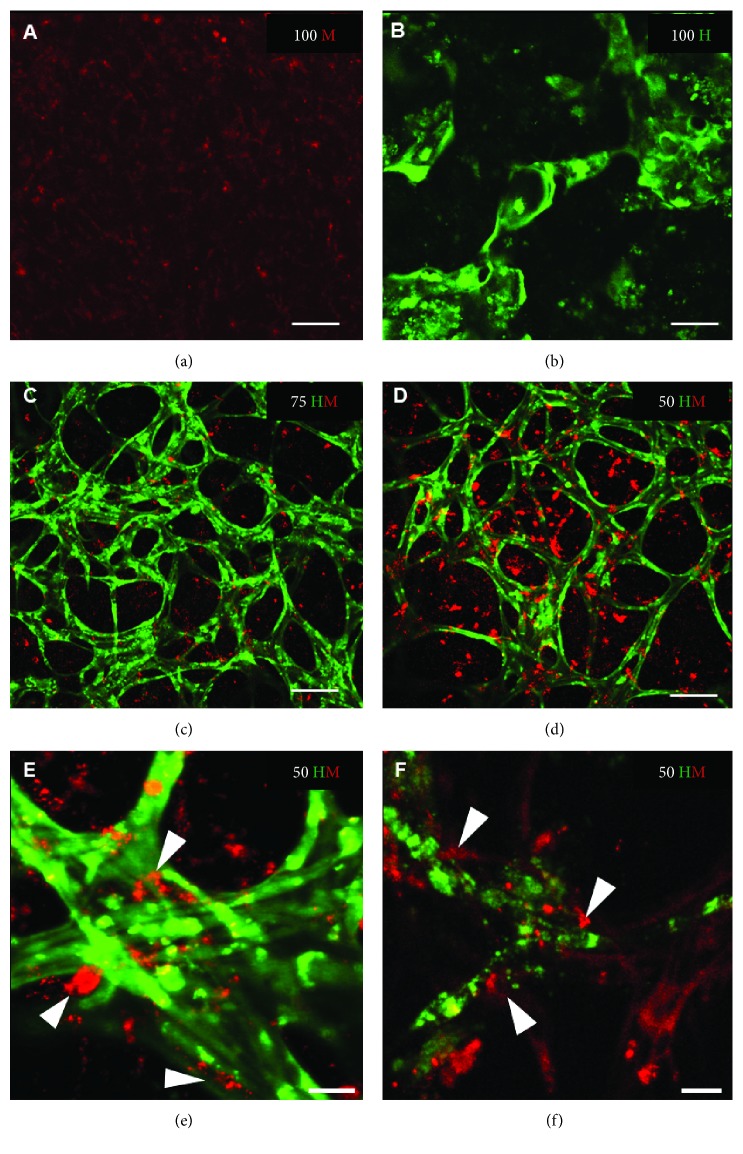
High-resolution images of HUVEC and MSC mono- and cocultures after 2 weeks. Representative images are shown from mono- and cocultures at day 14 after seeding (seeding density: 2.5 × 10³ cells/μl gel) with (a) 100% MSCs (100 M); (b) 100% HUVECs (100 H); (c) 75% HUVECs–25% MSCs (75 HM); and (d–f) 50% HUVECs–50% MSCs (50 HM). Network formation occurred in 100 H and both cocultures but was only stable in the presence of MSCs which integrate in cellular networks as demonstrated in e and f (white arrow heads). Scale bar = 100 μm (a–d), 25 μm (e, f).

