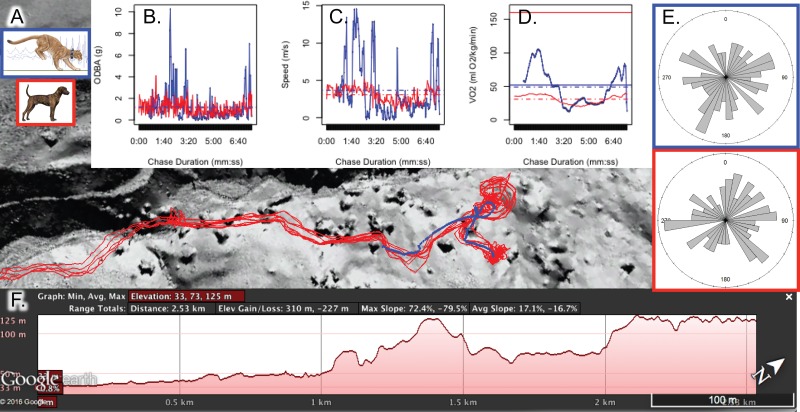
Figure 1. Chase 1 pursuit (red lines = hounds) and escape (blue line = puma) paths (A), including the elevation profile for Brandy, a GPS-accelerometer collar equipped hound.
Insets display ODBA (g, B), speed (ms−1, C), and estimated mass-specific metabolic demand ( in ml O2kg−1min−1, D) For (B), (C), and (D), mean values are presented as dashed horizontal lines, and solid horizontal lines in (D) depict for each species. Tortuosity plots (proportion of turns in each compass direction, (E) and the elevation profile for the accelerometer-GPS-equipped hound (F) are also presented. Map data© 2016 Google.

