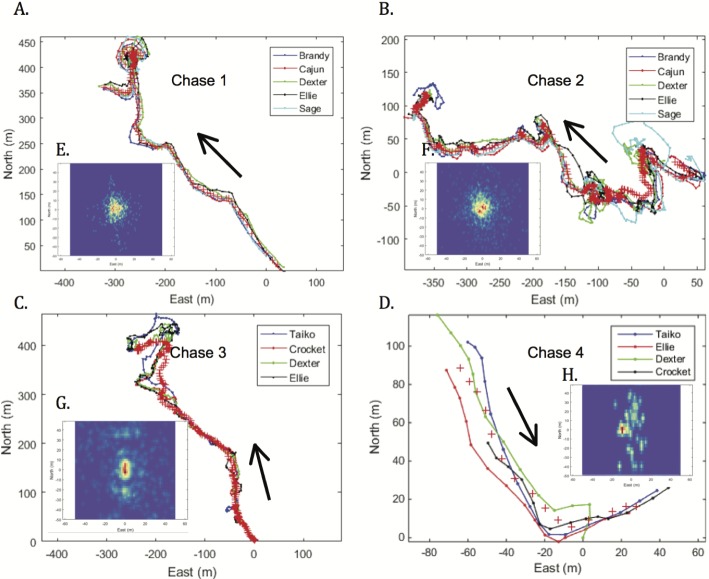
Figure 4. Hound pursuit paths (A–D) and 2D-spatial histograms (E–H) of pack cohesion over the course of each chase, with black arrows indicating direction of chase.
Every 3 s, the group centroid throughout each pursuit path is marked as a red plus (+). In the spatial histogram insets, the relative position of each hound relative to the group centroid is scaled by color, with warm colors representing close group cohesion and cool colors depicting more distant spacing.

