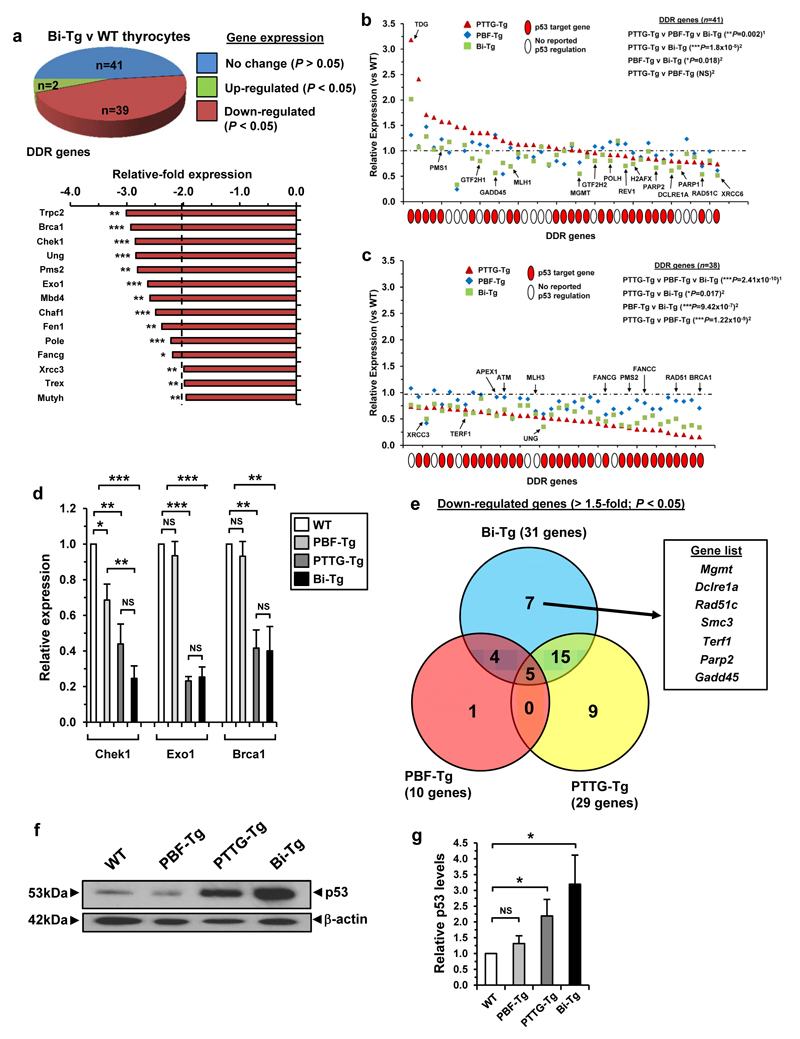
Figure 2. Impaired DDR gene expression in Bi-Tg thyroids.
(a) Pie chart summarizes number of DDR gene expression changes between thyrocytes from male Bi-Tg and WT mice (n=3 arrays). Graph (below) shows DDR genes with mRNA repressed ≥2.0-fold in Bi-Tg thyrocytes (mean, n=3, unpaired two-tailed t-test) (*P<0.05; **P<0.01; ***P<0.001). (b) Transcriptional signature of subset of DDR genes in PTTG-Tg (triangles), PBF-Tg (diamonds) and Bi-Tg (squares) thyrocytes with relative expression >0.8 (range 0.8-3.2 in PTTG-Tg) (mean, n=3 arrays, 1Kruskal-Wallis test, 2Mann-Whitney test) (NS, not significant; *P=0.018; **P=0.002; ***P=1.8x10⁻⁵). Red filled circle indicates p53 target gene. SRD5A2, TNP1 and RBBP4 from (a) were not included due to lack of expression in all 4 genotypes. (c) Same as (b) except using subset of DDR genes with relative expression <0.8 (range 0.15-0.8 in PTTG-Tg) (*P=0.017; ***P values are shown). (d) qPCR analysis of Chek1, Exo1 and Brca1 expression in thyrocytes of indicated genotypes (mean±s.e.m., n=4, unpaired two-tailed t-test) (NS, not significant; *P<0.05; **P<0.01; ***P<0.001). (e) Venn diagram of DDR genes with repressed expression (>1.5-fold; *P<0.05) for thyrocytes of indicated genotype compared to WT (n=3). Genes listed are unique to Bi-Tg thyrocytes (box). (f) Western blot of p53 levels in thyroid gland lysates for each genotype as indicated. Blot shown is representative from 4 independent experiments. (g) Quantification of mean p53 protein levels relative to β-actin (mean±s.e.m., n=4, unpaired two-tailed t-test) (NS, not significant; *P<0.05).

