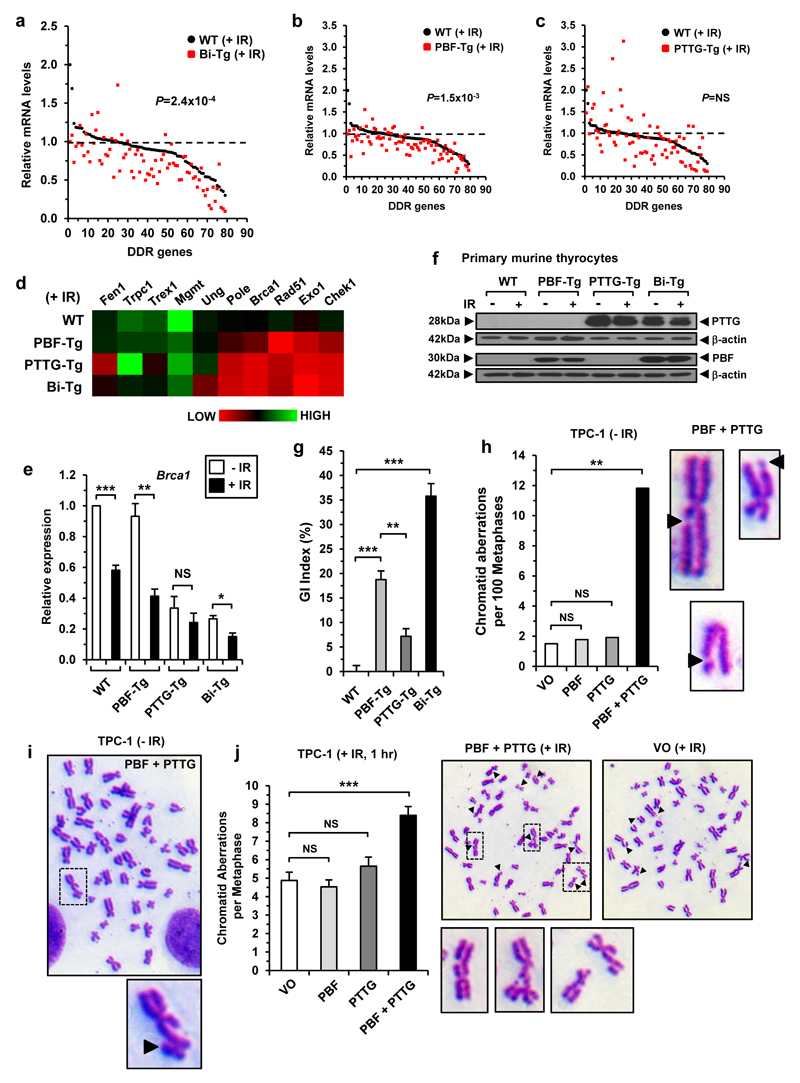
Figure 3. Transcriptional signature of DDR genes in irradiated murine thyrocytes.
(a) DDR gene expression profile of irradiated (+IR) Bi-Tg and WT thyrocytes (mean, n=3 arrays, Mann-Whitney test, ***P=2.4x10⁻⁴). (b) Same as (a) except DDR expression profile shown between irradiated PBF-Tg and WT thyrocytes. (c) Same as (a) except DDR expression profile shown between irradiated PTTG-Tg and WT thyrocytes. (d) Heatmap showing relative expression levels for 10 DDR genes between indicated genotypes. (e) Relative fold change in Brca1 expression in irradiated (+IR) thyrocytes of each genotype versus non-irradiated (-IR) controls (mean±s.e.m., n=4, unpaired two-tailed t-test) (NS, not significant; *P<0.05; **P<0.01; ***P<0.001). (f) Representative Western blot of PTTG and PBF in irradiated (+IR) thyrocytes of each genotype relative to untreated controls (-IR). (g) Quantification of genetic instability (GI) in murine primary thyrocytes for each genotype (mean±s.e.m., n=5, unpaired two-tailed t-test) (**P<0.01; ***P<0.001). (h) Chromosomal aberrations in TPC-1 cells at 48 h post-transfection (VO, n=69; PBF, n=56; PTTG, n=52; PBF+PTTG, n=93; Fisher’s exact test). Representative images of PBF+PTTG-induced chromatid gaps are shown (right, black arrowheads) (i) Representative metaphase spread of TPC-1 cells transfected with PBF+PTTG. Boxed area is magnified showing chromatid break (black arrowhead). (j) Chromatid aberrations in TPC-1 cells irradiated with 1 Gy dose at 48 h post-transfection (mean±s.e.m., VO, n=32; PBF, n=34; PTTG, n=31; PBF+PTTG, n=47; unpaired two-tailed t-test) (NS, not significant; ***P<0.001). Representative metaphase spreads for irradiated TPC-1 cells transfected with PBF+PTTG or VO are shown. Boxed areas are magnified and show representative chromatid aberrations (i.e. gaps, exchanges and breaks respectively). Black arrowheads indicate chromatid aberrations.

