
Fig. 1.
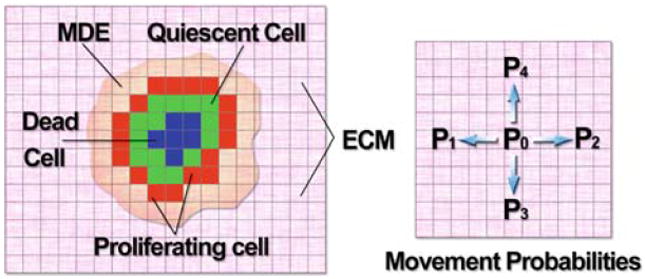
Schematic diagram (left) showing the key variables involved in the HDC model: tumour cells (colouration denoting cell state), extracellular matrix (ECM) and matrix degrading enzyme (MDE). Oxygen production comes from a pre-existing blood supply that is proportional to the ECM density. Diagram (right) shows the four possible directions each cell can move on the grid, driven by the movement probabilities P0 to P4, each cell can move at most one grid point at a time